PNC Bank 2012 Annual Report Download - page 116
Download and view the complete annual report
Please find page 116 of the 2012 PNC Bank annual report below. You can navigate through the pages in the report by either clicking on the pages listed below, or by using the keyword search tool below to find specific information within the annual report.-
 1
1 -
2
-
3
-
4
-
5
-
6
-
7
-
8
-
9
-
10
-
11
-
12
-
13
-
14
-
15
-
16
-
17
-
18
-
19
-
20
-
21
-
22
-
23
-
24
-
25
-
26
-
27
-
28
-
29
-
30
-
31
-
32
-
33
-
34
-
35
-
36
-
37
-
38
-
39
-
40
-
41
-
42
-
43
-
44
-
45
-
46
-
47
-
48
-
49
-
50
-
51
-
52
-
53
-
54
-
55
-
56
-
57
-
58
-
59
-
60
-
61
-
62
-
63
-
64
-
65
-
66
-
67
-
68
-
69
-
70
-
71
-
72
-
73
-
74
-
75
-
76
-
77
-
78
-
79
-
80
-
81
-
82
-
83
-
84
-
85
-
86
-
87
-
88
-
89
-
90
-
91
-
92
-
93
-
94
-
95
-
96
-
97
-
98
-
99
-
100
-
101
-
102
-
103
-
104
-
105
-
 106
106 -
 107
107 -
 108
108 -
 109
109 -
 110
110 -
 111
111 -
 112
112 -
 113
113 -
 114
114 -
 115
115 -
 116
116 -
 117
117 -
 118
118 -
 119
119 -
 120
120 -
 121
121 -
 122
122 -
 123
123 -
 124
124 -
 125
125 -
 126
126 -
127
-
128
-
129
-
130
-
131
-
132
-
133
-
134
-
135
-
136
-
137
-
138
-
139
-
140
-
141
-
142
-
143
-
144
-
145
-
146
-
147
-
148
-
149
-
150
-
151
-
152
-
153
-
154
-
155
-
156
-
157
-
158
-
159
-
160
-
161
-
162
-
163
-
164
-
165
-
166
-
167
-
168
-
169
-
170
-
171
-
172
-
173
-
174
-
175
-
176
-
177
-
178
-
179
-
180
-
181
-
182
-
183
-
184
-
185
-
186
-
187
-
188
-
189
-
190
-
191
-
192
-
193
-
194
-
195
-
196
-
197
-
198
-
199
-
200
-
201
-
202
-
203
-
204
-
205
-
206
-
207
-
208
-
209
-
210
-
211
-
212
-
213
-
214
-
215
-
216
-
217
-
218
-
219
-
220
-
221
-
222
-
223
-
224
-
225
-
226
-
227
-
228
-
229
-
230
-
231
-
232
-
233
-
234
-
235
-
236
-
237
-
238
-
239
-
240
-
241
-
242
-
243
-
244
-
245
-
246
-
247
-
248
-
249
-
250
-
251
-
252
-
253
-
254
-
255
-
256
-
257
-
258
-
259
-
260
-
261
-
262
-
263
-
264
-
265
-
266
-
267
-
268
-
269
-
270
-
271
-
272
-
273
-
274
-
275
-
276
-
277
-
278
-
279
-
280
 |
 |

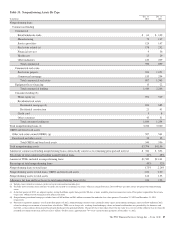
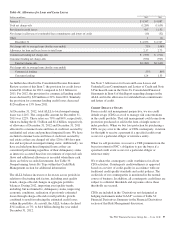
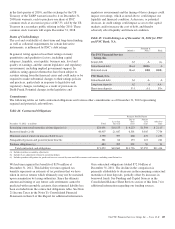
Table 44: Allowance for Loan and Lease Losses
Dollars in millions 2012 2011
January 1 $ 4,347 $ 4,887
Total net charge-offs (1,289) (1,639)
Provision for credit losses 987 1,152
Net change in allowance for unfunded loan commitments and letters of credit (10) (52)
Other 1 (1)
December 31 $ 4,036 $ 4,347
Net charge-offs to average loans (for the year ended) .73% 1.08%
Allowance for loan and lease losses to total loans 2.17 2.73
Commercial lending net charge-offs $ (359) $ (712)
Consumer lending net charge-offs (930) (927)
Total net charge-offs $(1,289) $(1,639)
Net charge-offs to average loans (for the year ended)
Commercial lending .35% .86%
Consumer lending 1.24 1.33
As further described in the Consolidated Income Statement
Review section of this Item 7, the provision for credit losses
totaled $1.0 billion for 2012 compared to $1.2 billion for
2011. For 2012, the provision for commercial lending credit
losses declined by $39 million or 22% from 2011. Similarly,
the provision for consumer lending credit losses decreased
$126 million or 13% from 2011.
At December 31, 2012, total ALLL to total nonperforming
loans was 124%. The comparable amount for December 31,
2011 was 122%. These ratios are 79% and 84%, respectively,
when excluding the $1.5 billion and $1.4 billion, respectively,
of allowance at December 31, 2012 and December 31, 2011
allocated to consumer loans and lines of credit not secured by
residential real estate and purchased impaired loans. We have
excluded consumer loans and lines of credit not secured by
real estate as they are charged off after 120 to 180 days past
due and not placed on nonperforming status. Additionally, we
have excluded purchased impaired loans as they are
considered performing regardless of their delinquency status
as interest is accreted based on our estimate of expected cash
flows and additional allowance is recorded when these cash
flows are below recorded investment. See Table 33:
Nonperforming Assets By Type within this Credit Risk
Management section for additional information.
The ALLL balance increases or decreases across periods in
relation to fluctuating risk factors, including asset quality
trends, charge-offs and changes in aggregate portfolio
balances. During 2012, improving asset quality trends,
including, but not limited to, delinquency status, improving
economic conditions, realization of previously estimated
losses through charge-offs and overall portfolio growth,
combined to result in reducing the estimated credit losses
within the portfolio. As a result, the ALLL balance declined
$311 million, or 7%, to $4.0 billion during the year ended
December 31, 2012.
See Note 7 Allowances for Loan and Lease Losses and
Unfunded Loan Commitments and Letters of Credit and Note
6 Purchased Loans in the Notes To Consolidated Financial
Statements in Item 8 of this Report regarding changes in the
ALLL and in the allowance for unfunded loan commitments
and letters of credit.
C
REDIT
D
EFAULT
S
WAPS
From a credit risk management perspective, we use credit
default swaps (CDS) as a tool to manage risk concentrations
in the credit portfolio. That risk management could come from
protection purchased or sold in the form of single name or
index products. When we buy loss protection by purchasing a
CDS, we pay a fee to the seller, or CDS counterparty, in return
for the right to receive a payment if a specified credit event
occurs for a particular obligor or reference entity.
When we sell protection, we receive a CDS premium from the
buyer in return for PNC’s obligation to pay the buyer if a
specified credit event occurs for a particular obligor or
reference entity.
We evaluate the counterparty credit worthiness for all our
CDS activities. Counterparty creditworthiness is approved
based on a review of credit quality in accordance with our
traditional credit quality standards and credit policies. The
credit risk of our counterparties is monitored in the normal
course of business. In addition, all counterparty credit lines are
subject to collateral thresholds and exposures above these
thresholds are secured.
CDSs are included in the “Derivatives not designated as
hedging instruments under GAAP” section of Table 54:
Financial Derivatives Summary in the Financial Derivatives
section of this Risk Management discussion.
The PNC Financial Services Group, Inc. – Form 10-K 97