PNC Bank 2012 Annual Report Download - page 221
Download and view the complete annual report
Please find page 221 of the 2012 PNC Bank annual report below. You can navigate through the pages in the report by either clicking on the pages listed below, or by using the keyword search tool below to find specific information within the annual report.-
 1
1 -
2
-
3
-
4
-
5
-
6
-
7
-
8
-
9
-
10
-
11
-
12
-
13
-
14
-
15
-
16
-
17
-
18
-
19
-
20
-
21
-
22
-
23
-
24
-
25
-
26
-
27
-
28
-
29
-
30
-
31
-
32
-
33
-
34
-
35
-
36
-
37
-
38
-
39
-
40
-
41
-
42
-
43
-
44
-
45
-
46
-
47
-
48
-
49
-
50
-
51
-
52
-
53
-
54
-
55
-
56
-
57
-
58
-
59
-
60
-
61
-
62
-
63
-
64
-
65
-
66
-
67
-
68
-
69
-
70
-
71
-
72
-
73
-
74
-
75
-
76
-
77
-
78
-
79
-
80
-
81
-
82
-
83
-
84
-
85
-
86
-
87
-
88
-
89
-
90
-
91
-
92
-
93
-
94
-
95
-
96
-
97
-
98
-
99
-
100
-
101
-
102
-
103
-
104
-
105
-
106
-
107
-
108
-
109
-
110
-
111
-
112
-
113
-
114
-
115
-
116
-
117
-
118
-
119
-
120
-
121
-
122
-
123
-
124
-
125
-
126
-
127
-
128
-
129
-
130
-
131
-
132
-
133
-
134
-
135
-
136
-
137
-
138
-
139
-
140
-
141
-
142
-
143
-
144
-
145
-
146
-
147
-
148
-
149
-
150
-
151
-
152
-
153
-
154
-
155
-
156
-
157
-
158
-
159
-
160
-
161
-
162
-
163
-
164
-
165
-
166
-
167
-
168
-
169
-
170
-
171
-
172
-
173
-
174
-
175
-
176
-
177
-
178
-
179
-
180
-
181
-
182
-
183
-
184
-
185
-
186
-
187
-
188
-
189
-
190
-
191
-
192
-
193
-
194
-
195
-
196
-
197
-
198
-
199
-
200
-
201
-
202
-
203
-
204
-
205
-
206
-
207
-
208
-
209
-
210
-
 211
211 -
 212
212 -
 213
213 -
 214
214 -
 215
215 -
 216
216 -
 217
217 -
 218
218 -
 219
219 -
 220
220 -
 221
221 -
 222
222 -
 223
223 -
 224
224 -
 225
225 -
 226
226 -
 227
227 -
 228
228 -
 229
229 -
 230
230 -
 231
231 -
232
-
233
-
234
-
235
-
236
-
237
-
238
-
239
-
240
-
241
-
242
-
243
-
244
-
245
-
246
-
247
-
248
-
249
-
250
-
251
-
252
-
253
-
254
-
255
-
256
-
257
-
258
-
259
-
260
-
261
-
262
-
263
-
264
-
265
-
266
-
267
-
268
-
269
-
270
-
271
-
272
-
273
-
274
-
275
-
276
-
277
-
278
-
279
-
280
 |
 |

N
OTE
16 S
TOCK
B
ASED
C
OMPENSATION
P
LANS
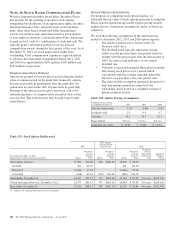
We have long-term incentive award plans (Incentive Plans)
that provide for the granting of incentive stock options,
nonqualified stock options, stock appreciation rights, incentive
shares/performance units, restricted stock, restricted share
units, other share-based awards and dollar-denominated
awards to executives and, other than incentive stock options,
to non-employee directors. Certain Incentive Plan awards may
be paid in stock, cash or a combination of stock and cash. We
typically grant a substantial portion of our stock-based
compensation awards during the first quarter of the year. As of
December 31, 2012, no stock appreciation rights were
outstanding. Total compensation expense recognized related
to all share-based payment arrangements during 2012, 2011
and 2010 was approximately $101 million, $103 million and
$107 million, respectively.
N
ONQUALIFIED
S
TOCK
O
PTIONS
Options are granted at exercise prices not less than the market
value of common stock on the grant date. Generally, options
become exercisable in installments after the grant date. No
option may be exercisable after 10 years from its grant date.
Payment of the option exercise price may be in cash or by
surrendering shares of common stock at market value on the
exercise date. The exercise price may be paid in previously
owned shares.
O
PTION
P
RICING
A
SSUMPTIONS
For purposes of computing stock option expense, we
estimated the fair value of stock options primarily by using the
Black-Scholes option-pricing model. Option pricing models
require the use of numerous assumptions, many of which are
subjective.
We used the following assumptions in the option pricing
models to determine 2012, 2011 and 2010 option expense:
• The risk-free interest rate is based on the US
Treasury yield curve,
• The dividend yield typically represents average
yields over the previous three-year period, however
starting with the grants made after the first quarter of
2009, we used a yield indicative of our current
dividend rate,
• Volatility is measured using the fluctuation in month-
end closing stock prices over a period which
corresponds with the average expected option life,
but in no case less than a five-year period, and
• The expected life assumption represents the period of
time that options granted are expected to be
outstanding and is based on a weighted-average of
historical option activity.
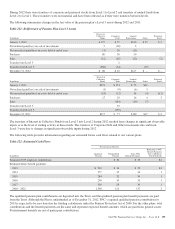
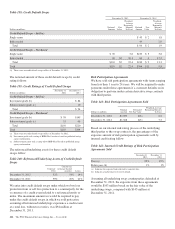
Table 128: Option Pricing Assumptions
Weighted-average for the
year ended December 31 2012 2011 2010
Risk-free interest rate 1.1% 2.8% 2.9%
Dividend yield 2.3 0.6 0.7
Volatility 35.1 34.7 32.7
Expected life 5.9 yrs. 5.9 yrs. 6.0 yrs.
Grant date fair value $ 16.22 $ 22.82 $ 19.54
Table 129: Stock Option Rollforward
PNC
PNC Options
Converted From
National City Total
Year ended December 31, 2012
In thousands, except weighted-average data Shares
Weighted-
Average
Exercise
Price Shares
Weighted-
Average
Exercise
Price Shares
Weighted-
Average
Exercise
Price
Weighted-
Average
Remaining
Contractual
Life
Aggregate
Intrinsic
Value
Outstanding, January 1 17,490 $54.48 949 $684.40 18,439 $ 86.90
Granted 461 60.70 461 60.70
Exercised (2,496) 47.48 (2,496) 47.48
Cancelled (638) 62.24 (202) 696.36 (840) 214.70
Outstanding, December 31 14,817 $55.52 747 $681.16 15,564 $ 85.55 5.0 years $105,159
Vested and expected to vest, December 31 (a) 14,793 $55.51 747 $681.16 15,540 $ 85.59 5.0 years $105,158
Exercisable, December 31 12,012 $54.15 747 $681.16 12,759 $ 90.86 4.6 years $102,539
(a) Adjusted for estimated forfeitures on unvested options.
202 The PNC Financial Services Group, Inc. – Form 10-K