PNC Bank 2012 Annual Report Download - page 255
Download and view the complete annual report
Please find page 255 of the 2012 PNC Bank annual report below. You can navigate through the pages in the report by either clicking on the pages listed below, or by using the keyword search tool below to find specific information within the annual report.-
 1
1 -
2
-
3
-
4
-
5
-
6
-
7
-
8
-
9
-
10
-
11
-
12
-
13
-
14
-
15
-
16
-
17
-
18
-
19
-
20
-
21
-
22
-
23
-
24
-
25
-
26
-
27
-
28
-
29
-
30
-
31
-
32
-
33
-
34
-
35
-
36
-
37
-
38
-
39
-
40
-
41
-
42
-
43
-
44
-
45
-
46
-
47
-
48
-
49
-
50
-
51
-
52
-
53
-
54
-
55
-
56
-
57
-
58
-
59
-
60
-
61
-
62
-
63
-
64
-
65
-
66
-
67
-
68
-
69
-
70
-
71
-
72
-
73
-
74
-
75
-
76
-
77
-
78
-
79
-
80
-
81
-
82
-
83
-
84
-
85
-
86
-
87
-
88
-
89
-
90
-
91
-
92
-
93
-
94
-
95
-
96
-
97
-
98
-
99
-
100
-
101
-
102
-
103
-
104
-
105
-
106
-
107
-
108
-
109
-
110
-
111
-
112
-
113
-
114
-
115
-
116
-
117
-
118
-
119
-
120
-
121
-
122
-
123
-
124
-
125
-
126
-
127
-
128
-
129
-
130
-
131
-
132
-
133
-
134
-
135
-
136
-
137
-
138
-
139
-
140
-
141
-
142
-
143
-
144
-
145
-
146
-
147
-
148
-
149
-
150
-
151
-
152
-
153
-
154
-
155
-
156
-
157
-
158
-
159
-
160
-
161
-
162
-
163
-
164
-
165
-
166
-
167
-
168
-
169
-
170
-
171
-
172
-
173
-
174
-
175
-
176
-
177
-
178
-
179
-
180
-
181
-
182
-
183
-
184
-
185
-
186
-
187
-
188
-
189
-
190
-
191
-
192
-
193
-
194
-
195
-
196
-
197
-
198
-
199
-
200
-
201
-
202
-
203
-
204
-
205
-
206
-
207
-
208
-
209
-
210
-
211
-
212
-
213
-
214
-
215
-
216
-
217
-
218
-
219
-
220
-
221
-
222
-
223
-
224
-
225
-
226
-
227
-
228
-
229
-
230
-
231
-
232
-
233
-
234
-
235
-
236
-
237
-
238
-
239
-
240
-
241
-
242
-
243
-
244
-
 245
245 -
 246
246 -
 247
247 -
 248
248 -
 249
249 -
 250
250 -
 251
251 -
 252
252 -
 253
253 -
 254
254 -
 255
255 -
 256
256 -
 257
257 -
 258
258 -
 259
259 -
 260
260 -
 261
261 -
 262
262 -
 263
263 -
 264
264 -
 265
265 -
266
-
267
-
268
-
269
-
270
-
271
-
272
-
273
-
274
-
275
-
276
-
277
-
278
-
279
-
280
 |
 |

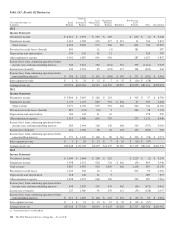
S
TATISTICAL
I
NFORMATION
(U
NAUDITED
)
THE PNC FINANCIAL SERVICES GROUP, INC.
Selected Quarterly Financial Data
Dollars in millions,
except per share data
2012 (a) 2011
Fourth Third Second First Fourth Third Second First
Summary Of Operations
Interest income $2,671 $2,670 $2,796 $2,597 $2,534 $2,530 $2,547 $2,583
Interest expense 247 271 270 306 335 355 397 407
Net interest income 2,424 2,399 2,526 2,291 2,199 2,175 2,150 2,176
Noninterest income (b) 1,645 1,689 1,097 1,441 1,350 1,369 1,452 1,455
Total revenue 4,069 4,088 3,623 3,732 3,549 3,544 3,602 3,631
Provision for credit losses 318 228 256 185 190 261 280 421
Noninterest expense 2,829 2,650 2,648 2,455 2,719 2,140 2,176 2,070
Income from continuing operations before income taxes and
noncontrolling interests 922 1,210 719 1,092 640 1,143 1,146 1,140
Income taxes 203 285 173 281 147 309 234 308
Net income 719 925 546 811 493 834 912 832
Less: Net income (loss) attributable to noncontrolling interests 1 (14) (5) 6 17 4 (1) (5)
Preferred stock dividends and discount accretion 54 63 25 39 25 4 25 4
Net income attributable to common shareholders $ 664 $ 876 $ 526 $ 766 $ 451 $ 826 $ 888 $ 833
Per Common Share Data
Book value $67.05 $66.41 $64.00 $63.26 $61.52 $61.92 $60.02 $58.01
Basic earnings from net income (c) 1.26 1.66 1.00 1.45 .86 1.57 1.69 1.59
Diluted earnings from net income (c) 1.24 1.64 .98 1.44 .85 1.55 1.67 1.57
(a) Includes the impact of RBC Bank (USA), which we acquired on March 2, 2012.
(b) Noninterest income included private equity gains/(losses) and net gains on sales of securities in each quarter as follows:
2012 2011
in millions Fourth Third Second First Fourth Third Second First
Private equity gains/(losses) $43 $25 $47 $50 $ 4 $46 $42 $53
Net gains on sales of securities 45 40 62 57 62 68 82 37
(c) The sum of the quarterly amounts for 2012 and 2011 does not equal the respective year’s amount because the quarterly calculations are based on a changing number of average shares.
236 The PNC Financial Services Group, Inc. – Form 10-K