PNC Bank 2012 Annual Report Download - page 197
Download and view the complete annual report
Please find page 197 of the 2012 PNC Bank annual report below. You can navigate through the pages in the report by either clicking on the pages listed below, or by using the keyword search tool below to find specific information within the annual report.-
 1
1 -
2
-
3
-
4
-
5
-
6
-
7
-
8
-
9
-
10
-
11
-
12
-
13
-
14
-
15
-
16
-
17
-
18
-
19
-
20
-
21
-
22
-
23
-
24
-
25
-
26
-
27
-
28
-
29
-
30
-
31
-
32
-
33
-
34
-
35
-
36
-
37
-
38
-
39
-
40
-
41
-
42
-
43
-
44
-
45
-
46
-
47
-
48
-
49
-
50
-
51
-
52
-
53
-
54
-
55
-
56
-
57
-
58
-
59
-
60
-
61
-
62
-
63
-
64
-
65
-
66
-
67
-
68
-
69
-
70
-
71
-
72
-
73
-
74
-
75
-
76
-
77
-
78
-
79
-
80
-
81
-
82
-
83
-
84
-
85
-
86
-
87
-
88
-
89
-
90
-
91
-
92
-
93
-
94
-
95
-
96
-
97
-
98
-
99
-
100
-
101
-
102
-
103
-
104
-
105
-
106
-
107
-
108
-
109
-
110
-
111
-
112
-
113
-
114
-
115
-
116
-
117
-
118
-
119
-
120
-
121
-
122
-
123
-
124
-
125
-
126
-
127
-
128
-
129
-
130
-
131
-
132
-
133
-
134
-
135
-
136
-
137
-
138
-
139
-
140
-
141
-
142
-
143
-
144
-
145
-
146
-
147
-
148
-
149
-
150
-
151
-
152
-
153
-
154
-
155
-
156
-
157
-
158
-
159
-
160
-
161
-
162
-
163
-
164
-
165
-
166
-
167
-
168
-
169
-
170
-
171
-
172
-
173
-
174
-
175
-
176
-
177
-
178
-
179
-
180
-
181
-
182
-
183
-
184
-
185
-
186
-
 187
187 -
 188
188 -
 189
189 -
 190
190 -
 191
191 -
 192
192 -
 193
193 -
 194
194 -
 195
195 -
 196
196 -
 197
197 -
 198
198 -
 199
199 -
 200
200 -
 201
201 -
 202
202 -
 203
203 -
 204
204 -
 205
205 -
 206
206 -
 207
207 -
208
-
209
-
210
-
211
-
212
-
213
-
214
-
215
-
216
-
217
-
218
-
219
-
220
-
221
-
222
-
223
-
224
-
225
-
226
-
227
-
228
-
229
-
230
-
231
-
232
-
233
-
234
-
235
-
236
-
237
-
238
-
239
-
240
-
241
-
242
-
243
-
244
-
245
-
246
-
247
-
248
-
249
-
250
-
251
-
252
-
253
-
254
-
255
-
256
-
257
-
258
-
259
-
260
-
261
-
262
-
263
-
264
-
265
-
266
-
267
-
268
-
269
-
270
-
271
-
272
-
273
-
274
-
275
-
276
-
277
-
278
-
279
-
280
 |
 |

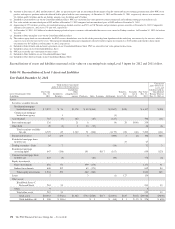
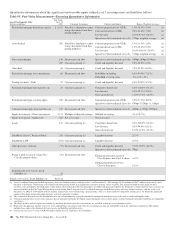
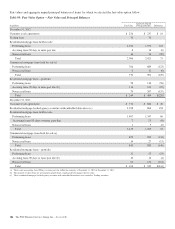
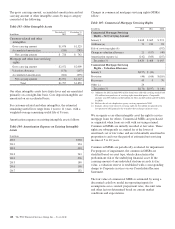
(b) Amounts at December 31, 2012 and December 31, 2011 are presented gross and are not reduced by the impact of legally enforceable master netting agreements that allow PNC to net
positive and negative positions and cash collateral held or placed with the same counterparty. At December 31, 2012 and December 31, 2011, respectively, the net asset amounts were
$2.4 billion and $2.4 billion and the net liability amounts were $.6 billion and $.7 billion.
(c) Included in Loans held for sale on our Consolidated Balance Sheet. PNC has elected the fair value option for certain commercial and residential mortgage loans held for sale.
(d) Fair value includes net unrealized gains of $59 million at December 31, 2012 compared with net unrealized gains of $102 million at December 31, 2011.
(e) Approximately 25% of these securities are residential mortgage-backed securities and 52% are US Treasury and government agencies securities at December 31, 2012. Comparable
amounts at December 31, 2011 were 57% and 34%, respectively.
(f) At December 31, 2011, $1.1 billion of residential mortgage-backed agency securities with embedded derivatives were carried in Trading securities. At December 31, 2012, the balance
was zero.
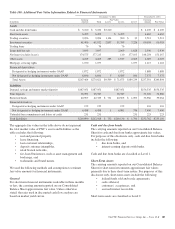
(g) Included in Other intangible assets on our Consolidated Balance Sheet.
(h) The indirect equity funds are not redeemable, but PNC receives distributions over the life of the partnership from liquidation of the underlying investments by the investee, which we
expect to occur over the next twelve years. The amount of unfunded contractual commitments related to indirect equity investments was $145 million and related to direct equity
investments was $37 million as of December 31, 2012, respectively.
(i) Included in Federal funds sold and resale agreements on our Consolidated Balance Sheet. PNC has elected the fair value option for these items.
(j) Included in Loans on our Consolidated Balance Sheet.
(k) PNC has elected the fair value option for these shares.
(l) Included in Other liabilities on our Consolidated Balance Sheet.
(m) Included in Other borrowed funds on our Consolidated Balance Sheet.
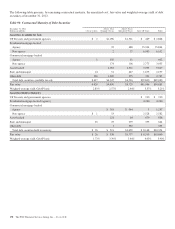
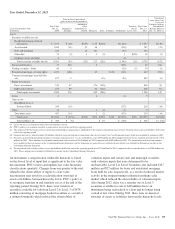
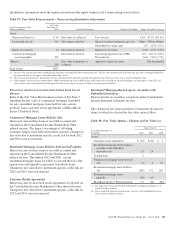
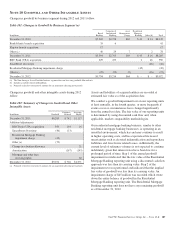
Reconciliations of assets and liabilities measured at fair value on a recurring basis using Level 3 inputs for 2012 and 2011 follow.
Table 94: Reconciliation of Level 3 Assets and Liabilities
Year Ended December 31, 2012
Total realized / unrealized
gains or losses for the period (a)
Unrealized
gains (losses) on
assets and
liabilities held on
Consolidated
Balance Sheet at
Dec. 31, 2012 (c)
Level 3 Instruments Only
In millions
Fair Value
Dec. 31,
2011
Included in
Earnings
Included in
Other
comprehensive
income Purchases Sales Issuances Settlements
Transfers
into
Level 3 (b)
Transfers
out of
Level 3 (b)
Fair Value
Dec. 31,
2012
Assets
Securities available for sale
Residential mortgage-
backed non-agency $ 5,557 $ 76 $1,178 $ 49 $(164) $(1,047) $458 $ 6,107 $ (99)
Commercial mortgage-
backed non-agency 1 (1)
Asset-backed 787 (7) 142 (87) (127) 708 (11)
State and municipal 336 21 6 (4) 20 $(40) 339
Other debt 49 (1) 1 16 (17) 48 (1)
Total securities available
for sale 6,729 69 1,342 71 (268) (1,179) 478 (40) 7,202 (111)
Financial derivatives 67 433 5 (400) 3 (2) 106 364
Residential mortgage loans
held for sale 27 27
Trading securities – Debt 39 7 (14) 32 3
Residential mortgage
servicing rights 647 (138) 191 $117 (167) 650 (123)
Commercial mortgage loans
held for sale 843 (5) (26) (40) 772 (8)
Equity investments
Direct investments 856 91 399 (175) 1,171 71
Indirect investments 648 102 63 (171) 642 94
Total equity investments 1,504 193 462 (346) 1,813 165
Loans 5 3 (1) 127 134
Other assets
BlackRock Series C
Preferred Stock 210 33 243 33
Other 9 9
Total other assets 219 33 252 33
Total assets $10,053 $ 592(e) $1,342 $732 $(640) $117 $(1,801) $635 $(42) $10,988 $323(f)
Total liabilities (d) $ 308 $ 134(e) $ 3 $ (68) $ 1 $ (2) $ 376 $ 69(f)
178 The PNC Financial Services Group, Inc. – Form 10-K