PNC Bank 2012 Annual Report Download - page 49
Download and view the complete annual report
Please find page 49 of the 2012 PNC Bank annual report below. You can navigate through the pages in the report by either clicking on the pages listed below, or by using the keyword search tool below to find specific information within the annual report.-
 1
1 -
2
-
3
-
4
-
5
-
6
-
7
-
8
-
9
-
10
-
11
-
12
-
13
-
14
-
15
-
16
-
17
-
18
-
19
-
20
-
21
-
22
-
23
-
24
-
25
-
26
-
27
-
28
-
29
-
30
-
31
-
32
-
33
-
34
-
35
-
36
-
37
-
38
-
 39
39 -
 40
40 -
 41
41 -
 42
42 -
 43
43 -
 44
44 -
 45
45 -
 46
46 -
 47
47 -
 48
48 -
 49
49 -
 50
50 -
 51
51 -
 52
52 -
 53
53 -
 54
54 -
 55
55 -
 56
56 -
 57
57 -
 58
58 -
 59
59 -
60
-
61
-
62
-
63
-
64
-
65
-
66
-
67
-
68
-
69
-
70
-
71
-
72
-
73
-
74
-
75
-
76
-
77
-
78
-
79
-
80
-
81
-
82
-
83
-
84
-
85
-
86
-
87
-
88
-
89
-
90
-
91
-
92
-
93
-
94
-
95
-
96
-
97
-
98
-
99
-
100
-
101
-
102
-
103
-
104
-
105
-
106
-
107
-
108
-
109
-
110
-
111
-
112
-
113
-
114
-
115
-
116
-
117
-
118
-
119
-
120
-
121
-
122
-
123
-
124
-
125
-
126
-
127
-
128
-
129
-
130
-
131
-
132
-
133
-
134
-
135
-
136
-
137
-
138
-
139
-
140
-
141
-
142
-
143
-
144
-
145
-
146
-
147
-
148
-
149
-
150
-
151
-
152
-
153
-
154
-
155
-
156
-
157
-
158
-
159
-
160
-
161
-
162
-
163
-
164
-
165
-
166
-
167
-
168
-
169
-
170
-
171
-
172
-
173
-
174
-
175
-
176
-
177
-
178
-
179
-
180
-
181
-
182
-
183
-
184
-
185
-
186
-
187
-
188
-
189
-
190
-
191
-
192
-
193
-
194
-
195
-
196
-
197
-
198
-
199
-
200
-
201
-
202
-
203
-
204
-
205
-
206
-
207
-
208
-
209
-
210
-
211
-
212
-
213
-
214
-
215
-
216
-
217
-
218
-
219
-
220
-
221
-
222
-
223
-
224
-
225
-
226
-
227
-
228
-
229
-
230
-
231
-
232
-
233
-
234
-
235
-
236
-
237
-
238
-
239
-
240
-
241
-
242
-
243
-
244
-
245
-
246
-
247
-
248
-
249
-
250
-
251
-
252
-
253
-
254
-
255
-
256
-
257
-
258
-
259
-
260
-
261
-
262
-
263
-
264
-
265
-
266
-
267
-
268
-
269
-
270
-
271
-
272
-
273
-
274
-
275
-
276
-
277
-
278
-
279
-
280
 |
 |

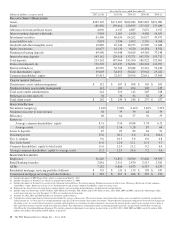
At or for the year ended December 31
Dollars in millions, except as noted 2012 (a) (b) 2011 (b) 2010 (b) 2009 (b) 2008 (c)
B
ALANCE
S
HEET
H
IGHLIGHTS
Assets $305,107 $271,205 $264,284 $269,863 $291,081
Loans 185,856 159,014 150,595 157,543 175,489
Allowance for loan and lease losses 4,036 4,347 4,887 5,072 3,917
Interest-earning deposits with banks 3,984 1,169 1,610 4,488 14,859
Investment securities 61,406 60,634 64,262 56,027 43,473
Loans held for sale 3,693 2,936 3,492 2,539 4,366
Goodwill and other intangible assets 10,869 10,144 10,753 12,909 11,688
Equity investments 10,877 10,134 9,220 10,254 8,554
Noninterest-bearing deposits 69,980 59,048 50,019 44,384 37,148
Interest-bearing deposits 143,162 128,918 133,371 142,538 155,717
Total deposits 213,142 187,966 183,390 186,922 192,865
Transaction deposits (d) 176,705 147,637 134,654 126,244 110,997
Borrowed funds (e) 40,907 36,704 39,488 39,261 52,240
Total shareholders’ equity 39,003 34,053 30,242 29,942 25,422
Common shareholders’ equity 35,413 32,417 29,596 22,011 17,490
C
LIENT
A
SSETS
(billions)
Discretionary assets under management $ 112 $ 107 $ 108 $ 103 $ 103
Nondiscretionary assets under management 112 103 104 102 125
Total assets under administration 224 210 212 205 228
Brokerage account assets (f) 38 34 34 32 29
Total client assets $ 262 $ 244 $ 246 $ 237 $ 257
S
ELECTED
R
ATIOS
Net interest margin (g) 3.94% 3.92% 4.14% 3.82% 3.37%
Noninterest income to total revenue 38 39 39 44 39
Efficiency 68 64 57 56 59
Return on
Average common shareholders’ equity 8.31 9.56 10.88 9.78 6.52
Average assets 1.02 1.16 1.28 .87 .64
Loans to deposits 87 85 82 84 91
Dividend payout 29.0 20.2 6.8 21.4 104.6
Tier 1 common 9.6 10.3 9.8 6.0 4.8
Tier 1 risk-based 11.6 12.6 12.1 11.4 9.7
Common shareholders’ equity to total assets 11.6 12.0 11.2 8.2 6.0
Average common shareholders’ equity to average assets 11.5 11.9 10.4 7.2 9.6
S
ELECTED
S
TATISTICS
Employees 56,285 51,891 50,769 55,820 59,595
Retail Banking branches 2,881 2,511 2,470 2,513 2,581
ATMs 7,282 6,806 6,673 6,473 6,233
Residential mortgage servicing portfolio (billions) $ 135 $ 131 $ 139 $ 158 $ 187
Commercial mortgage servicing portfolio (billions) $ 282 $ 267 $ 266 $ 287 $ 270
(a) Includes the impact of RBC Bank (USA), which we acquired on March 2, 2012.
(b) Includes the impact of National City, which we acquired on December 31, 2008.
(c) Includes the impact of National City except for the following Selected Ratios: Net interest margin, Noninterest income to total revenue, Efficiency, Return on Average common
shareholders’ equity, Return on Average assets, Dividend payout and Average common shareholders’ equity to average assets.
(d) Represents the sum of interest-bearing money market deposits, interest-bearing demand deposits, and noninterest-bearing deposits.
(e) Includes long-term borrowings of $19.3 billion, $20.9 billion, $24.8 billion, $26.3 billion and $33.6 billion for 2012, 2011, 2010, 2009 and 2008, respectively. Borrowings which
mature more than one year after December 31, 2012 are considered to be long-term.
(f) Amounts for 2012, 2011 and 2010 include cash and money market balances.
(g) Calculated as taxable-equivalent net interest income divided by average earning assets. The interest income earned on certain earning assets is completely or partially exempt from
federal income tax. As such, these tax-exempt instruments typically yield lower returns than taxable investments. To provide more meaningful comparisons of net interest margins for
all earning assets, we use net interest income on a taxable-equivalent basis in calculating net interest margin by increasing the interest income earned on tax-exempt assets to make it
fully equivalent to interest income earned on taxable investments. This adjustment is not permitted under accounting principles generally accepted in the United States of America
(GAAP) on the Consolidated Income Statement. The taxable-equivalent adjustments to net interest income for the years 2012, 2011, 2010, 2009 and 2008 were $144 million, $104
million, $81 million, $65 million and $36 million, respectively.
30 The PNC Financial Services Group, Inc. – Form 10-K