PNC Bank 2012 Annual Report Download - page 74
Download and view the complete annual report
Please find page 74 of the 2012 PNC Bank annual report below. You can navigate through the pages in the report by either clicking on the pages listed below, or by using the keyword search tool below to find specific information within the annual report.-
 1
1 -
2
-
3
-
4
-
5
-
6
-
7
-
8
-
9
-
10
-
11
-
12
-
13
-
14
-
15
-
16
-
17
-
18
-
19
-
20
-
21
-
22
-
23
-
24
-
25
-
26
-
27
-
28
-
29
-
30
-
31
-
32
-
33
-
34
-
35
-
36
-
37
-
38
-
39
-
40
-
41
-
42
-
43
-
44
-
45
-
46
-
47
-
48
-
49
-
50
-
51
-
52
-
53
-
54
-
55
-
56
-
57
-
58
-
59
-
60
-
61
-
62
-
63
-
 64
64 -
 65
65 -
 66
66 -
 67
67 -
 68
68 -
 69
69 -
 70
70 -
 71
71 -
 72
72 -
 73
73 -
 74
74 -
 75
75 -
 76
76 -
 77
77 -
 78
78 -
 79
79 -
 80
80 -
 81
81 -
 82
82 -
 83
83 -
 84
84 -
85
-
86
-
87
-
88
-
89
-
90
-
91
-
92
-
93
-
94
-
95
-
96
-
97
-
98
-
99
-
100
-
101
-
102
-
103
-
104
-
105
-
106
-
107
-
108
-
109
-
110
-
111
-
112
-
113
-
114
-
115
-
116
-
117
-
118
-
119
-
120
-
121
-
122
-
123
-
124
-
125
-
126
-
127
-
128
-
129
-
130
-
131
-
132
-
133
-
134
-
135
-
136
-
137
-
138
-
139
-
140
-
141
-
142
-
143
-
144
-
145
-
146
-
147
-
148
-
149
-
150
-
151
-
152
-
153
-
154
-
155
-
156
-
157
-
158
-
159
-
160
-
161
-
162
-
163
-
164
-
165
-
166
-
167
-
168
-
169
-
170
-
171
-
172
-
173
-
174
-
175
-
176
-
177
-
178
-
179
-
180
-
181
-
182
-
183
-
184
-
185
-
186
-
187
-
188
-
189
-
190
-
191
-
192
-
193
-
194
-
195
-
196
-
197
-
198
-
199
-
200
-
201
-
202
-
203
-
204
-
205
-
206
-
207
-
208
-
209
-
210
-
211
-
212
-
213
-
214
-
215
-
216
-
217
-
218
-
219
-
220
-
221
-
222
-
223
-
224
-
225
-
226
-
227
-
228
-
229
-
230
-
231
-
232
-
233
-
234
-
235
-
236
-
237
-
238
-
239
-
240
-
241
-
242
-
243
-
244
-
245
-
246
-
247
-
248
-
249
-
250
-
251
-
252
-
253
-
254
-
255
-
256
-
257
-
258
-
259
-
260
-
261
-
262
-
263
-
264
-
265
-
266
-
267
-
268
-
269
-
270
-
271
-
272
-
273
-
274
-
275
-
276
-
277
-
278
-
279
-
280
 |
 |

E
UROPEAN
E
XPOSURE
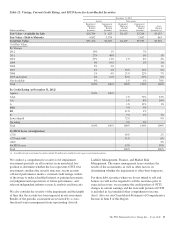
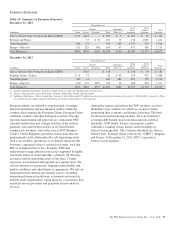
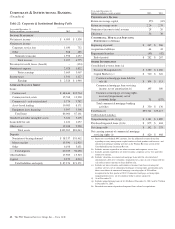
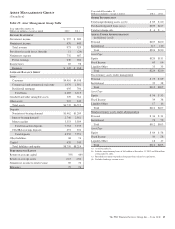
Table 19: Summary of European Exposure
December 31, 2012 Direct Exposure
Total
Exposure
Funded Unfunded Total
Direct
Exposure
Total
Indirect
ExposureIn millions Loans Leases Securities Total Other (a)
Greece, Ireland, Italy, Portugal and Spain (GIIPS) $ 85 $122 $ 207 $ 3 $ 210 $ 31 $ 241
Belgium and France 73 $ 30 103 35 138 1,083 1,221
United Kingdom 698 32 730 449 1,179 525 1,704
Europe - Other (b) 113 529 168 810 63 873 838 1,711
Total Europe (c) $896 $756 $198 $1,850 $550 $2,400 $2,477 $4,877
December 31, 2011
Direct Exposure
Total
Exposure
Funded Unfunded Total
Direct
Exposure
Total
Indirect
ExposureIn millions Loans Leases Securities Total Other (a)
Greece, Ireland, Italy, Portugal and Spain (GIIPS) $118 $ 118 $ 118 $ 63 $ 181
Belgium, France, Turkey $ 11 75 86 $ 68 154 935 1,089
United Kingdom 452 14 466 381 847 529 1,376
Europe - Other (b) 100 475 $357 932 36 968 803 1,771
Total Europe (c) $563 $682 $357 $1,602 $485 $2,087 $2,330 $4,417
(a) Includes unfunded commitments, guarantees, standby letters of credit, and sold protection credit derivatives.
(b) Europe - Other primarily consists of Denmark, Germany, Netherlands, Sweden, and Switzerland.
(c) Included within Europe - Other is funded direct exposure of $168 million and $357 million consisting of sovereign debt securities at December 31, 2012 and 2011, respectively. There
was no other direct or indirect exposure to European sovereigns as of December 31, 2012 and 2011.
European entities are defined as supranational, sovereign,
financial institutions and non-financial entities within the
countries that comprise the European Union, European Union
candidate countries and other European countries. Foreign
exposure underwriting and approvals are centralized. PNC
currently underwrites new foreign activities if the credit is
generally associated with activities of its United States
commercial customers, and, in the case of PNC Business
Credit’s United Kingdom operations, transactions that are
predominantly well collateralized by self liquidating assets
such as receivables, inventories or, in limited situations, the
borrower’s appraised value of certain fixed assets, such that
PNC is at minimal risk of loss. Formerly, PNC had
underwritten foreign infrastructure leases supported by highly
rated bank letters of credit and other collateral, US Treasury
securities and the underlying assets of the lease. Country
exposures are monitored and reported on a regular basis. We
actively monitor sovereign risk, banking system health, and
market conditions and adjust limits as appropriate. We rely on
information from internal and external sources, including
international financial institutions, economists and analysts,
industry trade organizations, rating agencies, econometric data
analytical service providers and geopolitical news analysis
services.
Among the regions and nations that PNC monitors, we have
identified seven countries for which we are more closely
monitoring their economic and financial situation. The basis
for the increased monitoring includes, but is not limited to,
sovereign debt burden, near term financing risk, political
instability, GDP trends, balance of payments, market
confidence, banking system distress and/or holdings of
stressed sovereign debt. The countries identified are: Greece,
Ireland, Italy, Portugal, Spain (collectively “GIIPS”), Belgium
and France. At December 31, 2012, PNC’s exposure to
Turkey was de minimis.
The PNC Financial Services Group, Inc. – Form 10-K 55