PNC Bank 2012 Annual Report Download - page 125
Download and view the complete annual report
Please find page 125 of the 2012 PNC Bank annual report below. You can navigate through the pages in the report by either clicking on the pages listed below, or by using the keyword search tool below to find specific information within the annual report.-
 1
1 -
2
-
3
-
4
-
5
-
6
-
7
-
8
-
9
-
10
-
11
-
12
-
13
-
14
-
15
-
16
-
17
-
18
-
19
-
20
-
21
-
22
-
23
-
24
-
25
-
26
-
27
-
28
-
29
-
30
-
31
-
32
-
33
-
34
-
35
-
36
-
37
-
38
-
39
-
40
-
41
-
42
-
43
-
44
-
45
-
46
-
47
-
48
-
49
-
50
-
51
-
52
-
53
-
54
-
55
-
56
-
57
-
58
-
59
-
60
-
61
-
62
-
63
-
64
-
65
-
66
-
67
-
68
-
69
-
70
-
71
-
72
-
73
-
74
-
75
-
76
-
77
-
78
-
79
-
80
-
81
-
82
-
83
-
84
-
85
-
86
-
87
-
88
-
89
-
90
-
91
-
92
-
93
-
94
-
95
-
96
-
97
-
98
-
99
-
100
-
101
-
102
-
103
-
104
-
105
-
106
-
107
-
108
-
109
-
110
-
111
-
112
-
113
-
114
-
 115
115 -
 116
116 -
 117
117 -
 118
118 -
 119
119 -
 120
120 -
 121
121 -
 122
122 -
 123
123 -
 124
124 -
 125
125 -
 126
126 -
 127
127 -
 128
128 -
 129
129 -
 130
130 -
 131
131 -
 132
132 -
 133
133 -
 134
134 -
 135
135 -
136
-
137
-
138
-
139
-
140
-
141
-
142
-
143
-
144
-
145
-
146
-
147
-
148
-
149
-
150
-
151
-
152
-
153
-
154
-
155
-
156
-
157
-
158
-
159
-
160
-
161
-
162
-
163
-
164
-
165
-
166
-
167
-
168
-
169
-
170
-
171
-
172
-
173
-
174
-
175
-
176
-
177
-
178
-
179
-
180
-
181
-
182
-
183
-
184
-
185
-
186
-
187
-
188
-
189
-
190
-
191
-
192
-
193
-
194
-
195
-
196
-
197
-
198
-
199
-
200
-
201
-
202
-
203
-
204
-
205
-
206
-
207
-
208
-
209
-
210
-
211
-
212
-
213
-
214
-
215
-
216
-
217
-
218
-
219
-
220
-
221
-
222
-
223
-
224
-
225
-
226
-
227
-
228
-
229
-
230
-
231
-
232
-
233
-
234
-
235
-
236
-
237
-
238
-
239
-
240
-
241
-
242
-
243
-
244
-
245
-
246
-
247
-
248
-
249
-
250
-
251
-
252
-
253
-
254
-
255
-
256
-
257
-
258
-
259
-
260
-
261
-
262
-
263
-
264
-
265
-
266
-
267
-
268
-
269
-
270
-
271
-
272
-
273
-
274
-
275
-
276
-
277
-
278
-
279
-
280
 |
 |
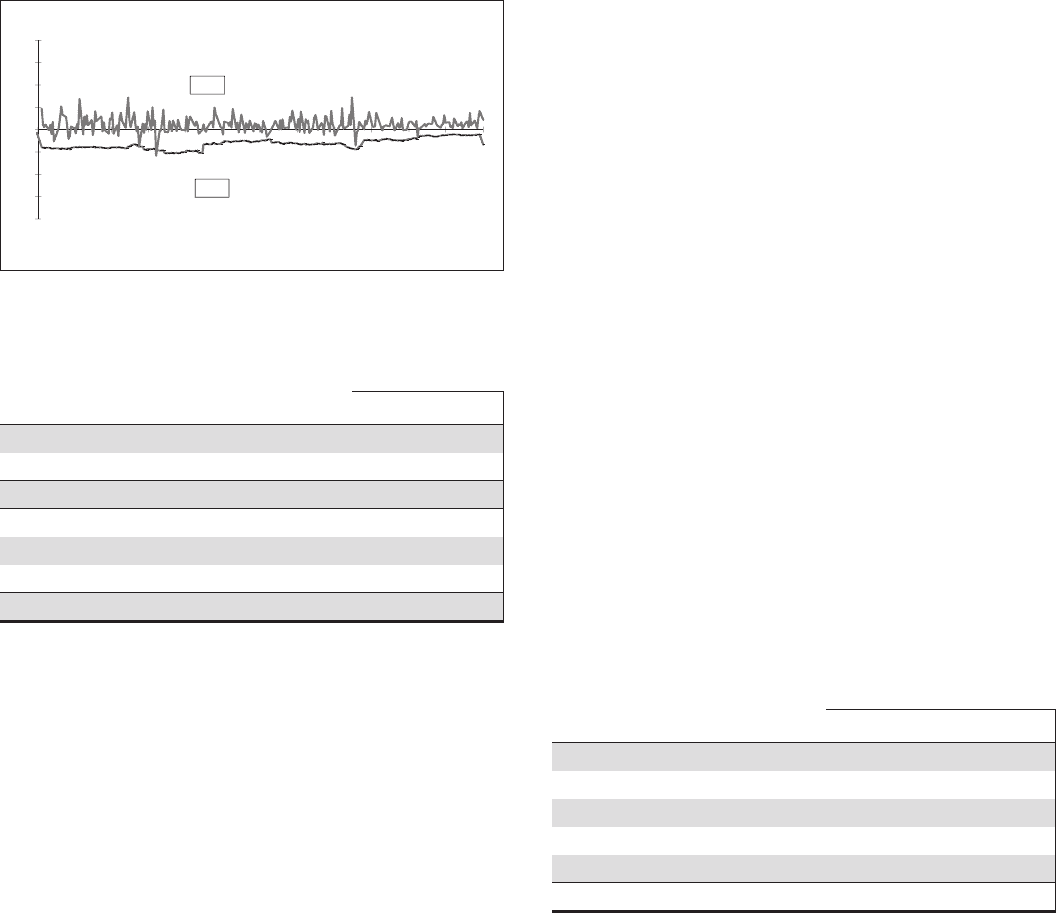
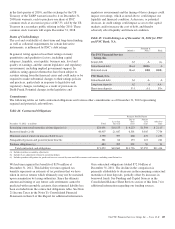
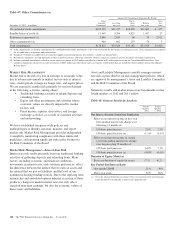
The following graph shows a comparison of enterprise-wide
trading-related gains and losses against prior day diversified
VaR for the period indicated.
Table 51: Enterprise-Wide Trading-Related Gains/Losses
Versus Value at Risk
(10)
(5)
0
5
10
15
20
Millions
P&L
(20)
(15)
(10)
VaR
12/31/11
1/31/12
2/29/12
3/31/12
4/30/12
5/31/12
6/30/12
7/31/12
8/31/12
9/30/12
10/31/12
11/30/12
12/31/12
Total trading revenue was as follows:
Table 52: Trading Revenue
Year ended December 31
In millions 2012 2011
Net interest income $ 38 $ 43
Noninterest income 272 225
Total trading revenue $310 $268
Securities underwriting and trading (a) $100 $ 81
Foreign exchange 92 88
Financial derivatives and other 118 99
Total trading revenue $310 $268
(a) Includes changes in fair value for certain loans accounted for at fair value.
The trading revenue disclosed above includes results from
providing investing and risk management services to our
customers as well as results from hedges of customer activity.
Trading revenue excludes the impact of economic hedging
activities which we transact to manage risk primarily related
to residential and commercial mortgage servicing rights and
residential and commercial mortgage loans held-for-sale.
Derivatives used for economic hedges are not designated as
accounting hedges because the contracts they are hedging are
typically also carried at fair value on the balance sheet,
resulting in symmetrical accounting treatment for both the
hedging instrument and the hedged item. Economic hedge
results, along with the associated hedged items, are reported in
the respective income statement line items, as appropriate.
Trading revenue for 2012 increased $42 million compared
with 2011 due to higher derivatives, foreign exchange and
fixed income client sales, higher underwriting activity,
improved client-related trading results and the reduced impact
of counterparty credit risk on valuations of derivative
positions.
Market Risk Management – Equity And Other
Investment Risk
Equity investment risk is the risk of potential losses associated
with investing in both private and public equity markets. PNC
invests primarily in private equity markets. In addition to
extending credit, taking deposits, and underwriting and trading
financial instruments, we make and manage direct investments
in a variety of transactions, including management buyouts,
recapitalizations, and growth financings in a variety of
industries. We also have investments in affiliated and non-
affiliated funds that make similar investments in private equity
and in debt and equity-oriented hedge funds. The economic
and/or book value of these investments and other assets such
as loan servicing rights are directly affected by changes in
market factors.
The primary risk measurement for equity and other
investments is economic capital. Economic capital is a
common measure of risk for credit, market and operational
risk. It is an estimate of the potential value depreciation over a
one year horizon commensurate with solvency expectations of
an institution rated single-A by the credit rating agencies.
Given the illiquid nature of many of these types of
investments, it can be a challenge to determine their fair
values. See Note 9 Fair Value in the Notes To Consolidated
Financial Statements in Item 8 of this Report for additional
information.
Various PNC business units manage our equity and other
investment activities. Our businesses are responsible for
making investment decisions within the approved policy limits
and associated guidelines.
A summary of our equity investments follows:
Table 53: Equity Investments Summary
In millions
December 31
2012
December 31
2011
BlackRock $ 5,614 $ 5,291
Tax credit investments 2,965 2,646
Private equity 1,802 1,491
Visa 251 456
Other 245 250
Total $10,877 $10,134
BlackRock
PNC owned approximately 36 million common stock
equivalent shares of BlackRock equity at December 31, 2012,
accounted for under the equity method. The primary risk
measurement, similar to other equity investments, is economic
capital. The Business Segments Review section of this Item 7
includes additional information about BlackRock.
106 The PNC Financial Services Group, Inc. – Form 10-K