PNC Bank 2012 Annual Report Download - page 210
Download and view the complete annual report
Please find page 210 of the 2012 PNC Bank annual report below. You can navigate through the pages in the report by either clicking on the pages listed below, or by using the keyword search tool below to find specific information within the annual report.-
 1
1 -
 2
2 -
 3
3 -
 4
4 -
 5
5 -
 6
6 -
 7
7 -
 8
8 -
 9
9 -
 10
10 -
 11
11 -
 12
12 -
 13
13 -
 14
14 -
 15
15 -
 16
16 -
 17
17 -
 18
18 -
 19
19 -
 20
20 -
 21
21 -
 22
22 -
 23
23 -
 24
24 -
 25
25 -
 26
26 -
 27
27 -
 28
28 -
 29
29 -
 30
30 -
 31
31 -
 32
32 -
 33
33 -
 34
34 -
 35
35 -
 36
36 -
 37
37 -
 38
38 -
 39
39 -
 40
40 -
 41
41 -
 42
42 -
 43
43 -
 44
44 -
 45
45 -
 46
46 -
 47
47 -
 48
48 -
 49
49 -
 50
50 -
 51
51 -
 52
52 -
 53
53 -
 54
54 -
 55
55 -
 56
56 -
 57
57 -
 58
58 -
 59
59 -
 60
60 -
 61
61 -
 62
62 -
 63
63 -
 64
64 -
 65
65 -
 66
66 -
 67
67 -
 68
68 -
 69
69 -
 70
70 -
 71
71 -
 72
72 -
 73
73 -
 74
74 -
 75
75 -
 76
76 -
 77
77 -
 78
78 -
 79
79 -
 80
80 -
 81
81 -
 82
82 -
 83
83 -
 84
84 -
 85
85 -
 86
86 -
 87
87 -
 88
88 -
 89
89 -
 90
90 -
 91
91 -
 92
92 -
 93
93 -
 94
94 -
 95
95 -
 96
96 -
 97
97 -
 98
98 -
 99
99 -
 100
100 -
 101
101 -
 102
102 -
 103
103 -
 104
104 -
 105
105 -
 106
106 -
 107
107 -
 108
108 -
 109
109 -
 110
110 -
 111
111 -
 112
112 -
 113
113 -
 114
114 -
 115
115 -
 116
116 -
 117
117 -
 118
118 -
 119
119 -
 120
120 -
 121
121 -
 122
122 -
 123
123 -
 124
124 -
 125
125 -
 126
126 -
 127
127 -
 128
128 -
 129
129 -
 130
130 -
 131
131 -
 132
132 -
 133
133 -
 134
134 -
 135
135 -
 136
136 -
 137
137 -
 138
138 -
 139
139 -
 140
140 -
 141
141 -
 142
142 -
 143
143 -
 144
144 -
 145
145 -
 146
146 -
 147
147 -
 148
148 -
 149
149 -
 150
150 -
 151
151 -
 152
152 -
 153
153 -
 154
154 -
 155
155 -
 156
156 -
 157
157 -
 158
158 -
 159
159 -
 160
160 -
 161
161 -
 162
162 -
 163
163 -
 164
164 -
 165
165 -
 166
166 -
 167
167 -
 168
168 -
 169
169 -
 170
170 -
 171
171 -
 172
172 -
 173
173 -
 174
174 -
 175
175 -
 176
176 -
 177
177 -
 178
178 -
 179
179 -
 180
180 -
 181
181 -
 182
182 -
 183
183 -
 184
184 -
 185
185 -
 186
186 -
 187
187 -
 188
188 -
 189
189 -
 190
190 -
 191
191 -
 192
192 -
 193
193 -
 194
194 -
 195
195 -
 196
196 -
 197
197 -
 198
198 -
 199
199 -
 200
200 -
 201
201 -
 202
202 -
 203
203 -
 204
204 -
 205
205 -
 206
206 -
 207
207 -
 208
208 -
 209
209 -
 210
210 -
 211
211 -
 212
212 -
 213
213 -
 214
214 -
 215
215 -
 216
216 -
 217
217 -
 218
218 -
 219
219 -
 220
220 -
 221
221 -
 222
222 -
 223
223 -
 224
224 -
 225
225 -
 226
226 -
 227
227 -
 228
228 -
 229
229 -
 230
230 -
 231
231 -
 232
232 -
 233
233 -
 234
234 -
 235
235 -
 236
236 -
 237
237 -
 238
238 -
 239
239 -
 240
240 -
 241
241 -
 242
242 -
 243
243 -
 244
244 -
 245
245 -
 246
246 -
 247
247 -
 248
248 -
 249
249 -
 250
250 -
 251
251 -
 252
252 -
 253
253 -
 254
254 -
 255
255 -
 256
256 -
 257
257 -
 258
258 -
 259
259 -
 260
260 -
 261
261 -
 262
262 -
 263
263 -
 264
264 -
 265
265 -
 266
266 -
 267
267 -
 268
268 -
 269
269 -
 270
270 -
 271
271 -
 272
272 -
 273
273 -
 274
274 -
 275
275 -
 276
276 -
 277
277 -
 278
278 -
 279
279 -
 280
280
 |
 |
N
OTE
12 T
IME
D
EPOSITS
The aggregate amount of time deposits with a denomination of
$100,000 or more was $9.3 billion at December 31, 2012 and
$11.2 billion at December 31, 2011.
Total time deposits of $26.1 billion at December 31, 2012
have future contractual maturities, including related purchase
accounting adjustments, as follows:
• 2013: $18.2 billion,
• 2014: $2.8 billion,
• 2015: $1.4 billion,
• 2016: $1.2 billion,
• 2017: $.4 billion, and
• 2018 and thereafter: $2.1 billion.
N
OTE
13 B
ORROWED
F
UNDS
Total borrowed funds of $40.9 billion at December 31, 2012
have contractually scheduled repayments, including related
purchase accounting adjustments, as follows:
• 2013: $21.6 billion,
• 2014: $3.6 billion,
• 2015: $2.9 billion,
• 2016: $1.9 billion,
• 2017: $3.1 billion, and
• 2018 and thereafter: $7.8 billion.
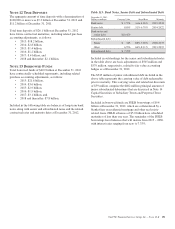
Included in the following table are balances of long-term bank
notes along with senior and subordinated notes and the related
contractual rates and maturity dates at December 31, 2012.
Table 113: Bank Notes, Senior Debt and Subordinated Debt
December 31, 2012
Dollars in millions Carrying Value Stated Rate Maturity
Bank notes $ 1,574 zero-4.66% 2013-2043
Senior debt 8,855 .51%-6.70% 2014-2022
Bank notes and
senior debt $10,429
Subordinated debt
Junior $ 343 .88%-7.00% 2028-2037
Other 6,956 .66%-8.11% 2013-2022
Subordinated debt $ 7,299
Included in outstandings for the senior and subordinated notes
in the table above are basis adjustments of $505 million and
$579 million, respectively, related to fair value accounting
hedges as of December 31, 2012.
The $343 million of junior subordinated debt included in the
above table represents the carrying value of debt redeemable
prior to maturity. This carrying value and related net discounts
of $59 million comprise the $402 million principal amount of
junior subordinated debentures that are discussed in Note 14
Capital Securities of Subsidiary Trusts and Perpetual Trust
Securities.
Included in borrowed funds are FHLB borrowings of $9.4
billion at December 31, 2012, which are collateralized by a
blanket lien on residential mortgage and other real estate-
related loans. FHLB advances of $5.0 billion have scheduled
maturities of less than one year. The remainder of the FHLB
borrowings have balances that will mature from 2013 – 2030,
with interest rates ranging from zero to 7.33%.
The PNC Financial Services Group, Inc. – Form 10-K 191
