PNC Bank 2012 Annual Report Download - page 56
Download and view the complete annual report
Please find page 56 of the 2012 PNC Bank annual report below. You can navigate through the pages in the report by either clicking on the pages listed below, or by using the keyword search tool below to find specific information within the annual report.-
 1
1 -
2
-
3
-
4
-
5
-
6
-
7
-
8
-
9
-
10
-
11
-
12
-
13
-
14
-
15
-
16
-
17
-
18
-
19
-
20
-
21
-
22
-
23
-
24
-
25
-
26
-
27
-
28
-
29
-
30
-
31
-
32
-
33
-
34
-
35
-
36
-
37
-
38
-
39
-
40
-
41
-
42
-
43
-
44
-
45
-
 46
46 -
 47
47 -
 48
48 -
 49
49 -
 50
50 -
 51
51 -
 52
52 -
 53
53 -
 54
54 -
 55
55 -
 56
56 -
 57
57 -
 58
58 -
 59
59 -
 60
60 -
 61
61 -
 62
62 -
 63
63 -
 64
64 -
 65
65 -
 66
66 -
67
-
68
-
69
-
70
-
71
-
72
-
73
-
74
-
75
-
76
-
77
-
78
-
79
-
80
-
81
-
82
-
83
-
84
-
85
-
86
-
87
-
88
-
89
-
90
-
91
-
92
-
93
-
94
-
95
-
96
-
97
-
98
-
99
-
100
-
101
-
102
-
103
-
104
-
105
-
106
-
107
-
108
-
109
-
110
-
111
-
112
-
113
-
114
-
115
-
116
-
117
-
118
-
119
-
120
-
121
-
122
-
123
-
124
-
125
-
126
-
127
-
128
-
129
-
130
-
131
-
132
-
133
-
134
-
135
-
136
-
137
-
138
-
139
-
140
-
141
-
142
-
143
-
144
-
145
-
146
-
147
-
148
-
149
-
150
-
151
-
152
-
153
-
154
-
155
-
156
-
157
-
158
-
159
-
160
-
161
-
162
-
163
-
164
-
165
-
166
-
167
-
168
-
169
-
170
-
171
-
172
-
173
-
174
-
175
-
176
-
177
-
178
-
179
-
180
-
181
-
182
-
183
-
184
-
185
-
186
-
187
-
188
-
189
-
190
-
191
-
192
-
193
-
194
-
195
-
196
-
197
-
198
-
199
-
200
-
201
-
202
-
203
-
204
-
205
-
206
-
207
-
208
-
209
-
210
-
211
-
212
-
213
-
214
-
215
-
216
-
217
-
218
-
219
-
220
-
221
-
222
-
223
-
224
-
225
-
226
-
227
-
228
-
229
-
230
-
231
-
232
-
233
-
234
-
235
-
236
-
237
-
238
-
239
-
240
-
241
-
242
-
243
-
244
-
245
-
246
-
247
-
248
-
249
-
250
-
251
-
252
-
253
-
254
-
255
-
256
-
257
-
258
-
259
-
260
-
261
-
262
-
263
-
264
-
265
-
266
-
267
-
268
-
269
-
270
-
271
-
272
-
273
-
274
-
275
-
276
-
277
-
278
-
279
-
280
 |
 |
per share, an increase of 5 cents per share, or 14
percent. PNC purchased $190 million of common
stock in 2012 under a $250 million authorization as
part of its existing 25 million share repurchase
program in open market or privately negotiated
transactions.
Our Consolidated Income Statement Review section of this
Item 7 describes in greater detail the various items that
impacted our results for 2012 and 2011.
A
VERAGE
C
ONSOLIDATED
B
ALANCE
S
HEET
H
IGHLIGHTS
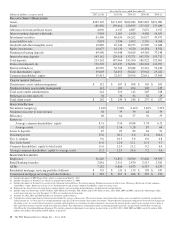
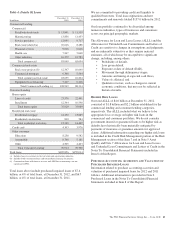
Total assets were $305.1 billion at December 31, 2012
compared with $271.2 billion at December 31, 2011. The
increase from year end 2011 was primarily due to the addition
of assets from the RBC Bank (USA) acquisition and organic
loan growth.
Various seasonal and other factors impact our period-end
balances whereas average balances are generally more
indicative of underlying business trends apart from the impact
of acquisitions and divestitures. The Consolidated Balance
Sheet Review section of this Item 7 provides information on
changes in selected Consolidated Balance Sheet categories at
December 31, 2012 compared with December 31, 2011.
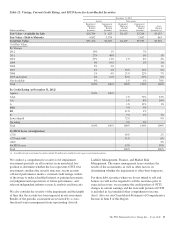
Total average assets increased to $295.0 billion for 2012
compared with $265.3 billion for 2011, reflecting an increase
of $24.2 billion in average interest-earning assets to $248.6
billion for 2012, compared with $224.3 billion in 2011. The
increase in average interest-earning assets was primarily
driven by an increase in average total loans, including those
acquired from the RBC Bank (USA) acquisition.
Total loans at December 31, 2012 increased $26.8 billion to
$185.9 billion compared to December 31, 2011. Average total
loans increased by $24.6 billion to $176.6 billion for 2012
compared with 2011, primarily due to increases in average
commercial loans of $17.2 billion and in average consumer
loans of $5.1 billion. Loans added from the RBC Bank (USA)
acquisition contributed to the increase. In addition, average
commercial loans increased from organic loan growth
primarily in corporate banking, real estate and asset-based
lending and average consumer loans increased due to growth
in indirect auto loans. Loans represented 71 percent of average
interest-earning assets for 2012 compared to 68 percent for
2011.
Average investment securities increased $1.1 billion to $60.8
billion in 2012 compared with 2011. Total investment
securities comprised 24 percent of average interest-earning
assets for 2012 and 27 percent for 2011.
Average noninterest-earning assets totaled $46.5 billion in
2012 compared with $41.0 billion in 2011. The increase
included the impact of higher adjustments for net unrealized
gains on securities, which are included in noninterest-earning
assets for average balance sheet purposes, the impact of the
RBC Bank (USA) acquisition, including goodwill, and an
increase in equity investments.
Average total deposits increased by $18.5 billion to $201.6
billion in 2012 compared with 2011. This increase primarily
resulted from an increase in average transaction deposits of
$23.9 billion partially offset by a decrease of $7.4 billion in
retail certificates of deposit attributable to runoff of maturing
accounts. Growth in average noninterest-bearing deposits,
average money market deposits and average interest-bearing
demand deposits drove the increase in transaction deposits,
which resulted from deposits added in the RBC Bank (USA)
acquisition and organic growth. Average transaction deposits
were $161.9 billion for 2012 compared with $138.0 billion for
2011. Total deposits at December 31, 2012 were $213.1
billion compared with $188.0 billion at December 31, 2011
and are further discussed within the Consolidated Balance
Sheet Review section of this Item 7.
Average total deposits represented 68 percent of average total
assets for 2012 and 69 percent for 2011.
Average borrowed funds increased to $41.8 billion for 2012
compared with $35.7 billion for 2011. An increase in
commercial paper and net issuances of Federal Home Loan
Bank (FHLB) borrowings during 2012 drove the increase
compared with 2011. Total borrowed funds at December 31,
2012 were $40.9 billion compared with $36.7 billion at
December 31, 2011 and are further discussed within the
Consolidated Balance Sheet Review section of this Item 7. In
addition, the Liquidity Risk Management portion of the Risk
Management section of this Item 7 includes additional
information regarding our sources and uses of borrowed
funds.
B
USINESS
S
EGMENT
H
IGHLIGHTS
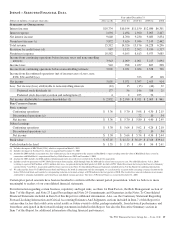
Total business segment earnings were $3.4 billion for 2012
and $3.1 billion for 2011. Highlights of results for 2012 and
2011 are included below. Enhancements were made to the
internal funds transfer pricing methodology during the second
quarter of 2012. Retrospective application of our new funds
transfer pricing methodology has been made to the prior
period reportable business segment results and disclosures to
create comparability to the current period presentation, which
we believe is more meaningful to readers of our financial
statements. Key reserve assumptions and estimation processes
react to and are influenced by observed changes in loan
portfolio performance experience, the financial strength of the
borrower, and economic conditions. Key reserve assumptions
are periodically updated. During the third quarter of 2012,
PNC increased the amount of internally observed data used in
estimating the key commercial lending assumptions of
Probabilities of Default (PDs) and Losses Given Default
(LGDs). The estimated impact as of the beginning of the third
quarter 2012 was approximately an increase of $41 million
and a decrease of $55 million to the provision for credit losses
of Retail Banking and Corporate & Institutional Banking,
respectively. Prior periods are not presented on a comparable
basis as it is not practicable to do so.
The PNC Financial Services Group, Inc. – Form 10-K 37