PNC Bank 2012 Annual Report Download - page 180
Download and view the complete annual report
Please find page 180 of the 2012 PNC Bank annual report below. You can navigate through the pages in the report by either clicking on the pages listed below, or by using the keyword search tool below to find specific information within the annual report.-
 1
1 -
2
-
3
-
4
-
5
-
6
-
7
-
8
-
9
-
10
-
11
-
12
-
13
-
14
-
15
-
16
-
17
-
18
-
19
-
20
-
21
-
22
-
23
-
24
-
25
-
26
-
27
-
28
-
29
-
30
-
31
-
32
-
33
-
34
-
35
-
36
-
37
-
38
-
39
-
40
-
41
-
42
-
43
-
44
-
45
-
46
-
47
-
48
-
49
-
50
-
51
-
52
-
53
-
54
-
55
-
56
-
57
-
58
-
59
-
60
-
61
-
62
-
63
-
64
-
65
-
66
-
67
-
68
-
69
-
70
-
71
-
72
-
73
-
74
-
75
-
76
-
77
-
78
-
79
-
80
-
81
-
82
-
83
-
84
-
85
-
86
-
87
-
88
-
89
-
90
-
91
-
92
-
93
-
94
-
95
-
96
-
97
-
98
-
99
-
100
-
101
-
102
-
103
-
104
-
105
-
106
-
107
-
108
-
109
-
110
-
111
-
112
-
113
-
114
-
115
-
116
-
117
-
118
-
119
-
120
-
121
-
122
-
123
-
124
-
125
-
126
-
127
-
128
-
129
-
130
-
131
-
132
-
133
-
134
-
135
-
136
-
137
-
138
-
139
-
140
-
141
-
142
-
143
-
144
-
145
-
146
-
147
-
148
-
149
-
150
-
151
-
152
-
153
-
154
-
155
-
156
-
157
-
158
-
159
-
160
-
161
-
162
-
163
-
164
-
165
-
166
-
167
-
168
-
169
-
 170
170 -
 171
171 -
 172
172 -
 173
173 -
 174
174 -
 175
175 -
 176
176 -
 177
177 -
 178
178 -
 179
179 -
 180
180 -
 181
181 -
 182
182 -
 183
183 -
 184
184 -
 185
185 -
 186
186 -
 187
187 -
 188
188 -
 189
189 -
 190
190 -
191
-
192
-
193
-
194
-
195
-
196
-
197
-
198
-
199
-
200
-
201
-
202
-
203
-
204
-
205
-
206
-
207
-
208
-
209
-
210
-
211
-
212
-
213
-
214
-
215
-
216
-
217
-
218
-
219
-
220
-
221
-
222
-
223
-
224
-
225
-
226
-
227
-
228
-
229
-
230
-
231
-
232
-
233
-
234
-
235
-
236
-
237
-
238
-
239
-
240
-
241
-
242
-
243
-
244
-
245
-
246
-
247
-
248
-
249
-
250
-
251
-
252
-
253
-
254
-
255
-
256
-
257
-
258
-
259
-
260
-
261
-
262
-
263
-
264
-
265
-
266
-
267
-
268
-
269
-
270
-
271
-
272
-
273
-
274
-
275
-
276
-
277
-
278
-
279
-
280
 |
 |

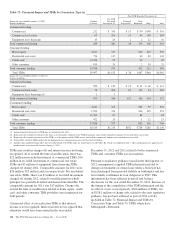
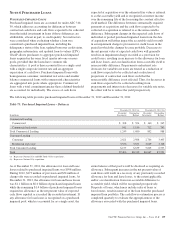
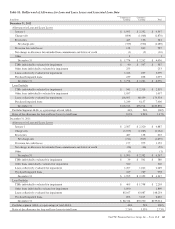
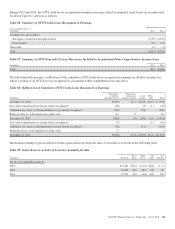
RBC Bank (USA) Purchased Non-Impaired Loans
Other purchased loans acquired in the RBC Bank (USA) acquisition were recorded at fair value as provided in the table below. The
difference between the acquisition date fair value and the outstanding balance represents the fair value adjustment for a loan and
includes both credit and interest rate considerations. Fair values were determined by discounting both principal and interest cash
flows expected to be collected using a market discount rate for similar instruments with adjustments that management believes a
market participant would consider in determining fair value. Fair value adjustments may be discounts (or premiums) to a loan’s
cost basis and are accreted (or amortized) to net interest income (or expense) over the loan’s remaining life in accordance with
ASC 310-20. Fair value adjustments for revolving loans are accreted (or amortized) using a straight line method. Term loans are
accreted (or amortized) using the constant effective yield method.
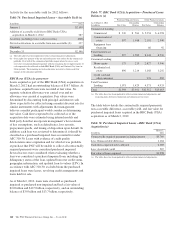
Table 79: Purchased Non-Impaired Loans – Fair Value (a)
As of March 2, 2012
In millions Commercial
Commercial
Real Estate
Equipment
Lease
Finance
Home
Equity
Residential
Real
Estate
Credit
Card and
Other
Consumer Total
Outstanding Balance $6,298 $2,340 $92 $3,346 $1,202 $385 $13,663
Less: Fair value adjustment 344 239 6 519 34 9 1,151
Fair value of loans acquired $5,954 $2,101 $86 $2,827 $1,168 $376 $12,512
(a) The table above has been updated to reflect certain immaterial adjustments.
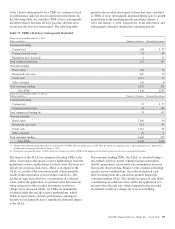
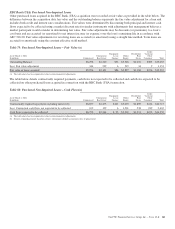
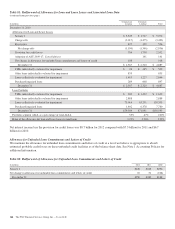
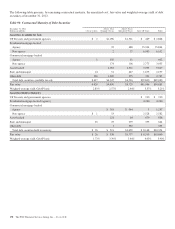
The table below details contractually required payments, cash flows not expected to be collected and cash flows expected to be
collected on other purchased loans acquired in connection with the RBC Bank (USA) transaction.
Table 80: Purchased Non-Impaired Loans – Cash Flows(a)
As of March 2, 2012
In millions Commercial
Commercial
Real Estate
Equipment
Lease
Finance
Home
Equity
Residential
Real
Estate
Credit
Card and
Other
Consumer Total
Contractually required repayments including interest (b) $6,857 $2,473 $101 $5,003 $1,869 $414 $16,717
Less: Contractual cash flows not expected to be collected 102 129 6 1,501 538 189 2,465
Cash flows expected to be collected $6,755 $2,344 $ 95 $3,502 $1,331 $225 $14,252
(a) The table above has been updated to reflect certain immaterial adjustments.
(b) Denotes required payments based on a loan’s contractual schedule assuming no loss or prepayment.
The PNC Financial Services Group, Inc. – Form 10-K 161