PNC Bank 2012 Annual Report Download - page 69
Download and view the complete annual report
Please find page 69 of the 2012 PNC Bank annual report below. You can navigate through the pages in the report by either clicking on the pages listed below, or by using the keyword search tool below to find specific information within the annual report.-
 1
1 -
2
-
3
-
4
-
5
-
6
-
7
-
8
-
9
-
10
-
11
-
12
-
13
-
14
-
15
-
16
-
17
-
18
-
19
-
20
-
21
-
22
-
23
-
24
-
25
-
26
-
27
-
28
-
29
-
30
-
31
-
32
-
33
-
34
-
35
-
36
-
37
-
38
-
39
-
40
-
41
-
42
-
43
-
44
-
45
-
46
-
47
-
48
-
49
-
50
-
51
-
52
-
53
-
54
-
55
-
56
-
57
-
58
-
 59
59 -
 60
60 -
 61
61 -
 62
62 -
 63
63 -
 64
64 -
 65
65 -
 66
66 -
 67
67 -
 68
68 -
 69
69 -
 70
70 -
 71
71 -
 72
72 -
 73
73 -
 74
74 -
 75
75 -
 76
76 -
 77
77 -
 78
78 -
 79
79 -
80
-
81
-
82
-
83
-
84
-
85
-
86
-
87
-
88
-
89
-
90
-
91
-
92
-
93
-
94
-
95
-
96
-
97
-
98
-
99
-
100
-
101
-
102
-
103
-
104
-
105
-
106
-
107
-
108
-
109
-
110
-
111
-
112
-
113
-
114
-
115
-
116
-
117
-
118
-
119
-
120
-
121
-
122
-
123
-
124
-
125
-
126
-
127
-
128
-
129
-
130
-
131
-
132
-
133
-
134
-
135
-
136
-
137
-
138
-
139
-
140
-
141
-
142
-
143
-
144
-
145
-
146
-
147
-
148
-
149
-
150
-
151
-
152
-
153
-
154
-
155
-
156
-
157
-
158
-
159
-
160
-
161
-
162
-
163
-
164
-
165
-
166
-
167
-
168
-
169
-
170
-
171
-
172
-
173
-
174
-
175
-
176
-
177
-
178
-
179
-
180
-
181
-
182
-
183
-
184
-
185
-
186
-
187
-
188
-
189
-
190
-
191
-
192
-
193
-
194
-
195
-
196
-
197
-
198
-
199
-
200
-
201
-
202
-
203
-
204
-
205
-
206
-
207
-
208
-
209
-
210
-
211
-
212
-
213
-
214
-
215
-
216
-
217
-
218
-
219
-
220
-
221
-
222
-
223
-
224
-
225
-
226
-
227
-
228
-
229
-
230
-
231
-
232
-
233
-
234
-
235
-
236
-
237
-
238
-
239
-
240
-
241
-
242
-
243
-
244
-
245
-
246
-
247
-
248
-
249
-
250
-
251
-
252
-
253
-
254
-
255
-
256
-
257
-
258
-
259
-
260
-
261
-
262
-
263
-
264
-
265
-
266
-
267
-
268
-
269
-
270
-
271
-
272
-
273
-
274
-
275
-
276
-
277
-
278
-
279
-
280
 |
 |

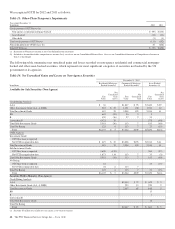
We sold $2.2 billion of commercial mortgages held for sale
carried at the lower of cost or market in 2012. The comparable
amount in 2011 was $2.4 billion. The increase in these loans
to $620 million at December 31, 2012, compared to $451
million at December 31, 2011, was due to an increase in loans
awaiting sale to government agencies.
We recognized total net gains of $41 million in 2012 and $48
million in 2011 on the valuation and sale of commercial
mortgage loans held for sale, net of hedges.
Residential mortgage loan origination volume was $15.2
billion in 2012 compared with $11.4 billion in 2011.
Substantially all such loans were originated under agency or
Federal Housing Administration (FHA) standards. We sold
$13.8 billion of loans and recognized related gains of $747
million during 2012. The comparable amounts for 2011 were
$11.9 billion and $384 million, respectively.
Interest income on loans held for sale was $168 million in
2012 and $193 million in 2011. These amounts are included in
Other interest income on our Consolidated Income Statement.
Additional information regarding our loan sale and servicing
activities is included in Note 3 Loan Sale and Servicing
Activities and Variable Interest Entities in our Notes To
Consolidated Financial Statements included in Item 8 of this
Report.
G
OODWILL AND
O
THER
I
NTANGIBLE
A
SSETS
Goodwill and other intangible assets totaled $10.9 billion at
December 31, 2012 and $10.1 billion at December 31, 2011.
During 2012, we recorded goodwill of $950 million and other
intangible assets of $180 million associated with the RBC
Bank (USA) acquisition. In the fourth quarter of 2012, we sold
certain deposits and assets of the Smartstreet business unit,
which was acquired by PNC as part of the RBC Bank (USA)
acquisition, which resulted in a reduction of goodwill and core
deposit intangibles by approximately $46 million and $13
million, respectively. Also in the fourth quarter of 2012, we
recorded a $45 million noncash charge for goodwill
impairment related to PNC’s Residential Mortgage Banking
business segment. See Note 2 Acquisition and Divestiture
Activity and Note 10 Goodwill and Other Intangible Assets in
the Notes To Consolidated Financial Statements included in
Item 8 of this Report.
F
UNDING AND
C
APITAL
S
OURCES
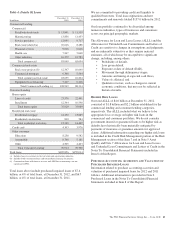
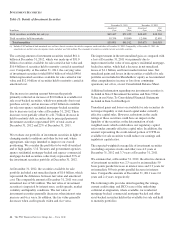
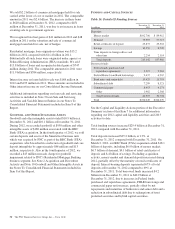
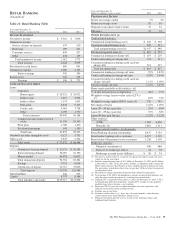
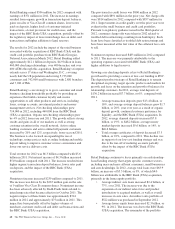
Table 16: Details Of Funding Sources
In millions
December 31
2012
December 31
2011
Deposits
Money market $102,706 $ 89,912
Demand 73,995 57,717
Retail certificates of deposit 23,837 29,518
Savings 10,350 8,705
Time deposits in foreign offices and
other time 2,254 2,114
Total deposits 213,142 187,966
Borrowed funds
Federal funds purchased and
repurchase agreements 3,327 2,984
Federal Home Loan Bank borrowings 9,437 6,967
Bank notes and senior debt 10,429 11,793
Subordinated debt 7,299 8,321
Commercial paper 8,453 4,271
Other 1,962 2,368
Total borrowed funds 40,907 36,704
Total $254,049 $224,670
See the Capital and Liquidity Actions portion of the Executive
Summary section of this Item 7 for additional information
regarding our 2012 capital and liquidity activities and 2013
activities to date.
Total funding sources increased $29.4 billion at December 31,
2012 compared with December 31, 2011.
Total deposits increased $25.2 billion, or 13%, at
December 31, 2012 compared with December 31, 2011. On
March 2, 2012, our RBC Bank (USA) acquisition added $18.1
billion of deposits, including $6.9 billion of money market,
$6.7 billion of demand, $4.1 billion of retail certificates of
deposit, and $.4 billion of savings. Excluding acquisition
activity, money market and demand deposits increased during
2012, partially offset by the maturity of retail certificates of
deposit. Interest-bearing deposits represented 67% of total
deposits at December 31, 2012 compared to 69% at
December 31, 2011. Total borrowed funds increased $4.2
billion from December 31, 2011 to $40.9 billion at
December 31, 2012, due to increases in Federal funds
purchased and repurchase agreements, FHLB borrowings and
commercial paper net issuances, partially offset by net
repayments and maturities of bank notes and senior debt and a
reduction in subordinated debt due to redemptions of trust
preferred securities and hybrid capital securities.
50 The PNC Financial Services Group, Inc. – Form 10-K