PNC Bank 2012 Annual Report Download - page 191
Download and view the complete annual report
Please find page 191 of the 2012 PNC Bank annual report below. You can navigate through the pages in the report by either clicking on the pages listed below, or by using the keyword search tool below to find specific information within the annual report.-
 1
1 -
2
-
3
-
4
-
5
-
6
-
7
-
8
-
9
-
10
-
11
-
12
-
13
-
14
-
15
-
16
-
17
-
18
-
19
-
20
-
21
-
22
-
23
-
24
-
25
-
26
-
27
-
28
-
29
-
30
-
31
-
32
-
33
-
34
-
35
-
36
-
37
-
38
-
39
-
40
-
41
-
42
-
43
-
44
-
45
-
46
-
47
-
48
-
49
-
50
-
51
-
52
-
53
-
54
-
55
-
56
-
57
-
58
-
59
-
60
-
61
-
62
-
63
-
64
-
65
-
66
-
67
-
68
-
69
-
70
-
71
-
72
-
73
-
74
-
75
-
76
-
77
-
78
-
79
-
80
-
81
-
82
-
83
-
84
-
85
-
86
-
87
-
88
-
89
-
90
-
91
-
92
-
93
-
94
-
95
-
96
-
97
-
98
-
99
-
100
-
101
-
102
-
103
-
104
-
105
-
106
-
107
-
108
-
109
-
110
-
111
-
112
-
113
-
114
-
115
-
116
-
117
-
118
-
119
-
120
-
121
-
122
-
123
-
124
-
125
-
126
-
127
-
128
-
129
-
130
-
131
-
132
-
133
-
134
-
135
-
136
-
137
-
138
-
139
-
140
-
141
-
142
-
143
-
144
-
145
-
146
-
147
-
148
-
149
-
150
-
151
-
152
-
153
-
154
-
155
-
156
-
157
-
158
-
159
-
160
-
161
-
162
-
163
-
164
-
165
-
166
-
167
-
168
-
169
-
170
-
171
-
172
-
173
-
174
-
175
-
176
-
177
-
178
-
179
-
180
-
 181
181 -
 182
182 -
 183
183 -
 184
184 -
 185
185 -
 186
186 -
 187
187 -
 188
188 -
 189
189 -
 190
190 -
 191
191 -
 192
192 -
 193
193 -
 194
194 -
 195
195 -
 196
196 -
 197
197 -
 198
198 -
 199
199 -
 200
200 -
 201
201 -
202
-
203
-
204
-
205
-
206
-
207
-
208
-
209
-
210
-
211
-
212
-
213
-
214
-
215
-
216
-
217
-
218
-
219
-
220
-
221
-
222
-
223
-
224
-
225
-
226
-
227
-
228
-
229
-
230
-
231
-
232
-
233
-
234
-
235
-
236
-
237
-
238
-
239
-
240
-
241
-
242
-
243
-
244
-
245
-
246
-
247
-
248
-
249
-
250
-
251
-
252
-
253
-
254
-
255
-
256
-
257
-
258
-
259
-
260
-
261
-
262
-
263
-
264
-
265
-
266
-
267
-
268
-
269
-
270
-
271
-
272
-
273
-
274
-
275
-
276
-
277
-
278
-
279
-
280
 |
 |
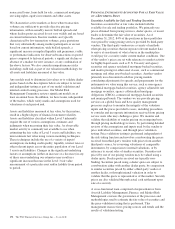
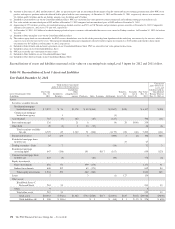
nonaccrual loans, loans held for sale, commercial mortgage
servicing rights, equity investments and other assets.
We characterize active markets as those where transaction
volumes are sufficient to provide objective pricing
information, with reasonably narrow bid/ask spreads and
where dealer quotes received do not vary widely and are based
on current information. Inactive markets are typically
characterized by low transaction volumes, price quotations
that vary substantially among market participants or are not
based on current information, wide bid/ask spreads, a
significant increase in implied liquidity risk premiums, yields,
or performance indicators for observed transactions or quoted
prices compared to historical periods, a significant decline or
absence of a market for new issuance, or any combination of
the above factors. We also consider nonperformance risks
including credit risk as part of our valuation methodology for
all assets and liabilities measured at fair value.
Any models used to determine fair values or to validate dealer
quotes based on the descriptions below are subject to review
and independent testing as part of our model validation and
internal control testing processes. Our Model Risk
Management Committee reviews significant models on at
least an annual basis. In addition, we have teams, independent
of the traders, which verify marks and assumptions used for
valuations at each period end.
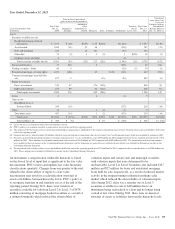
Assets and liabilities measured at fair value, by their nature,
result in a higher degree of financial statement volatility.
Assets and liabilities classified within Level 3 inherently
require the use of various assumptions, estimates and
judgments when measuring their fair value. As observable
market activity is commonly not available to use when
estimating the fair value of Level 3 assets and liabilities, we
must estimate fair value using various modeling techniques.
These techniques include the use of a variety of inputs/
assumptions including credit quality, liquidity, interest rates or
other relevant inputs across the entire population of our Level
3 assets and liabilities. Changes in the significant underlying
factors or assumptions (either an increase or a decrease) in any
of these areas underlying our estimates may result in a
significant increase/decrease in the Level 3 fair value
measurement of a particular asset and/or liability from period
to period.
F
INANCIAL
I
NSTRUMENTS
A
CCOUNTED
F
OR AT
F
AIR
V
ALUE
ON A
R
ECURRING
B
ASIS
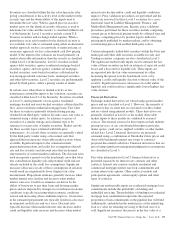
Securities Available for Sale and Trading Securities
Securities accounted for at fair value include both the
available for sale and trading portfolios. We primarily use
prices obtained from pricing services, dealer quotes, or recent
trades to determine the fair value of securities. As of
December 31, 2012, 84% of the positions in these portfolios
were priced by using pricing services provided by third-party
vendors. The third-party vendors use a variety of methods
when pricing securities that incorporate relevant market data
to arrive at an estimate of what a buyer in the marketplace
would pay for a security under current market conditions. One
of the vendor’s prices are set with reference to market activity
for highly liquid assets such as U.S. Treasury and agency
securities and agency residential mortgage-backed securities,
and matrix pricing for other asset classes, such as commercial
mortgage and other asset-backed securities. Another vendor
primarily uses discounted cash flow pricing models
considering adjustments for spreads and prepayments for the
instruments we value using this service, such as non-agency
residential mortgage-backed securities, agency adjustable rate
mortgage securities, agency collateralized mortgage
obligations (CMOs), commercial mortgage-backed securities
and municipal bonds. The vendors we use provide pricing
services on a global basis and have quality management
processes in place to monitor the integrity of the valuation
inputs and the prices provided to users, including procedures
to consider and incorporate information received from pricing
service users who may challenge a price. We monitor and
validate the reliability of vendor pricing on an ongoing basis
through pricing methodology reviews, by performing detailed
reviews of the assumptions and inputs used by the vendor to
price individual securities, and through price validation
testing. Price validation testing is performed independent of
the risk-taking function and involves corroborating the prices
received from third-party vendors with prices from another
third-party source, by reviewing valuations of comparable
instruments, by comparison to internal valuations, or by
reference to recent sales of similar securities. Securities not
priced by one of our pricing vendors may be valued using a
dealer quote. Dealer quotes received are typically non-
binding. Securities priced using a dealer quote are subject to
corroboration either with another dealer quote, by comparison
to similar securities priced by either a third-party vendor or
another dealer, or through internal valuation in order to
validate that the quote is representative of the market. Security
prices are also validated through actual cash settlement upon
sale of a security.
A cross-functional team comprised of representatives from
Asset & Liability Management, Finance, and Market Risk
Management oversees the governance of the processes and
methodologies used to estimate the fair value of securities and
the price validation testing that is performed. This
management team reviews pricing sources and trends and the
results of validation testing.
172 The PNC Financial Services Group, Inc. – Form 10-K