PNC Bank 2012 Annual Report Download - page 59
Download and view the complete annual report
Please find page 59 of the 2012 PNC Bank annual report below. You can navigate through the pages in the report by either clicking on the pages listed below, or by using the keyword search tool below to find specific information within the annual report.-
 1
1 -
2
-
3
-
4
-
5
-
6
-
7
-
8
-
9
-
10
-
11
-
12
-
13
-
14
-
15
-
16
-
17
-
18
-
19
-
20
-
21
-
22
-
23
-
24
-
25
-
26
-
27
-
28
-
29
-
30
-
31
-
32
-
33
-
34
-
35
-
36
-
37
-
38
-
39
-
40
-
41
-
42
-
43
-
44
-
45
-
46
-
47
-
48
-
 49
49 -
 50
50 -
 51
51 -
 52
52 -
 53
53 -
 54
54 -
 55
55 -
 56
56 -
 57
57 -
 58
58 -
 59
59 -
 60
60 -
 61
61 -
 62
62 -
 63
63 -
 64
64 -
 65
65 -
 66
66 -
 67
67 -
 68
68 -
 69
69 -
70
-
71
-
72
-
73
-
74
-
75
-
76
-
77
-
78
-
79
-
80
-
81
-
82
-
83
-
84
-
85
-
86
-
87
-
88
-
89
-
90
-
91
-
92
-
93
-
94
-
95
-
96
-
97
-
98
-
99
-
100
-
101
-
102
-
103
-
104
-
105
-
106
-
107
-
108
-
109
-
110
-
111
-
112
-
113
-
114
-
115
-
116
-
117
-
118
-
119
-
120
-
121
-
122
-
123
-
124
-
125
-
126
-
127
-
128
-
129
-
130
-
131
-
132
-
133
-
134
-
135
-
136
-
137
-
138
-
139
-
140
-
141
-
142
-
143
-
144
-
145
-
146
-
147
-
148
-
149
-
150
-
151
-
152
-
153
-
154
-
155
-
156
-
157
-
158
-
159
-
160
-
161
-
162
-
163
-
164
-
165
-
166
-
167
-
168
-
169
-
170
-
171
-
172
-
173
-
174
-
175
-
176
-
177
-
178
-
179
-
180
-
181
-
182
-
183
-
184
-
185
-
186
-
187
-
188
-
189
-
190
-
191
-
192
-
193
-
194
-
195
-
196
-
197
-
198
-
199
-
200
-
201
-
202
-
203
-
204
-
205
-
206
-
207
-
208
-
209
-
210
-
211
-
212
-
213
-
214
-
215
-
216
-
217
-
218
-
219
-
220
-
221
-
222
-
223
-
224
-
225
-
226
-
227
-
228
-
229
-
230
-
231
-
232
-
233
-
234
-
235
-
236
-
237
-
238
-
239
-
240
-
241
-
242
-
243
-
244
-
245
-
246
-
247
-
248
-
249
-
250
-
251
-
252
-
253
-
254
-
255
-
256
-
257
-
258
-
259
-
260
-
261
-
262
-
263
-
264
-
265
-
266
-
267
-
268
-
269
-
270
-
271
-
272
-
273
-
274
-
275
-
276
-
277
-
278
-
279
-
280
 |
 |
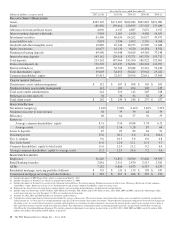
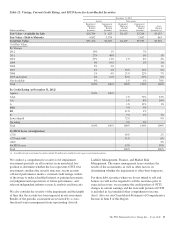
Residential mortgage revenue decreased to $284 million in
2012 from $713 million in 2011. This decrease of $429
million, or 60 percent, was largely due to a higher provision
for residential mortgage repurchase obligations of $761
million in 2012 compared with $102 million in 2011, partially
offset by an increase in loan sales revenue driven by higher
loan origination volume.
The higher provision for residential mortgage repurchase
obligations in 2012 reflected expected further elevated levels
of repurchase demands primarily as a result of changes in
behaviors and demand patterns of two government-sponsored
enterprises, FHLMC and FNMA, for loans sold into agency
securitizations. The recorded liability for residential mortgage
indemnification and repurchase claims was $614 million at
December 31, 2012. See the Recourse And Repurchase
Obligations section of this Item 7 for more detail.
Service charges on deposits grew to $573 million in 2012
compared with $534 million in 2011. This increase reflected
continued success in growing customers, including through
the RBC Bank (USA) acquisition.
Net gains on sales of securities totaled $204 million for 2012
and $249 million for 2011. The net credit component of other-
than-temporary impairment (OTTI) of securities recognized in
earnings was $111 million in 2012 compared with $152
million for 2011.
Other noninterest income increased by $.4 billion, or 38
percent, to $1.5 billion for 2012 compared with $1.1 billion
for 2011. This increase was primarily due to $267 million of
gains on sales of approximately 9 million Visa Class B
common shares during the third and fourth quarters of 2012,
as well as higher revenue associated with private equity
investments. We continue to hold approximately 14.4 million
Visa Class B common shares with an estimated fair value of
approximately $916 million as of December 31, 2012. Our
recorded investment in these remaining shares was
approximately $251 million at December 31, 2012.
Other noninterest income typically fluctuates from period to
period depending on the nature and magnitude of transactions
completed. Further details regarding our trading activities are
included in the Market Risk Management – Trading Risk
portion of the Risk Management section of this Item 7. Further
details regarding private and other equity investments are
included in the Market Risk Management – Equity And Other
Investment Risk portion of the Risk Management section of
this Item 7, and further details regarding gains or losses
related to our equity investment in BlackRock are included in
the Business Segments Review section of this Item 7.
For 2013, we currently expect both noninterest income and
total revenue to increase compared with 2012.
P
RODUCT
R
EVENUE
In addition to credit and deposit products for commercial
customers, Corporate & Institutional Banking offers other
services, including treasury management, capital markets-
related products and services, and commercial mortgage
banking activities for customers of all our business segments.
A portion of the revenue and expense related to these products
is reflected in the Corporate & Institutional Banking segment
results and the remainder is reflected in the results of other
businesses. The Other Information section in the Corporate &
Institutional Banking table in the Business Segments Review
section of this Item 7 includes the consolidated revenue to
PNC for these services. A discussion of the consolidated
revenue from these services follows.
Treasury management revenue, comprised of fees and net
interest income from customer deposit balances, totaled $1.4
billion for 2012 and $1.3 billion for 2011. Higher deposit
balances along with strong growth in commercial card,
lockbox and traditional products, including DDA, wire and
ACH, led to the favorable results.
Revenue from capital markets-related products and services
totaled $710 million in 2012 compared with $622 million in
2011. The comparison reflects higher merger and acquisition
advisory fees and strong customer driven capital markets
activity.
Commercial mortgage banking activities include revenue
derived from commercial mortgage servicing (including net
interest income and noninterest income from loan servicing
and ancillary services, net of commercial mortgage servicing
rights amortization, and commercial mortgage servicing rights
valuations net of economic hedge), and revenue derived from
commercial mortgage loans intended for sale and related
hedges (including loan origination fees, net interest income,
valuation adjustments and gains or losses on sales).
Commercial mortgage banking activities resulted in revenue
of $330 million in 2012 compared with $136 million in 2011.
The increase in the comparison was mainly due to the impact
of recoveries on commercial mortgage servicing rights in
2012 compared to impairments taken during 2011.
40 The PNC Financial Services Group, Inc. – Form 10-K