PNC Bank 2012 Annual Report Download - page 164
Download and view the complete annual report
Please find page 164 of the 2012 PNC Bank annual report below. You can navigate through the pages in the report by either clicking on the pages listed below, or by using the keyword search tool below to find specific information within the annual report.-
 1
1 -
2
-
3
-
4
-
5
-
6
-
7
-
8
-
9
-
10
-
11
-
12
-
13
-
14
-
15
-
16
-
17
-
18
-
19
-
20
-
21
-
22
-
23
-
24
-
25
-
26
-
27
-
28
-
29
-
30
-
31
-
32
-
33
-
34
-
35
-
36
-
37
-
38
-
39
-
40
-
41
-
42
-
43
-
44
-
45
-
46
-
47
-
48
-
49
-
50
-
51
-
52
-
53
-
54
-
55
-
56
-
57
-
58
-
59
-
60
-
61
-
62
-
63
-
64
-
65
-
66
-
67
-
68
-
69
-
70
-
71
-
72
-
73
-
74
-
75
-
76
-
77
-
78
-
79
-
80
-
81
-
82
-
83
-
84
-
85
-
86
-
87
-
88
-
89
-
90
-
91
-
92
-
93
-
94
-
95
-
96
-
97
-
98
-
99
-
100
-
101
-
102
-
103
-
104
-
105
-
106
-
107
-
108
-
109
-
110
-
111
-
112
-
113
-
114
-
115
-
116
-
117
-
118
-
119
-
120
-
121
-
122
-
123
-
124
-
125
-
126
-
127
-
128
-
129
-
130
-
131
-
132
-
133
-
134
-
135
-
136
-
137
-
138
-
139
-
140
-
141
-
142
-
143
-
144
-
145
-
146
-
147
-
148
-
149
-
150
-
151
-
152
-
153
-
 154
154 -
 155
155 -
 156
156 -
 157
157 -
 158
158 -
 159
159 -
 160
160 -
 161
161 -
 162
162 -
 163
163 -
 164
164 -
 165
165 -
 166
166 -
 167
167 -
 168
168 -
 169
169 -
 170
170 -
 171
171 -
 172
172 -
 173
173 -
 174
174 -
175
-
176
-
177
-
178
-
179
-
180
-
181
-
182
-
183
-
184
-
185
-
186
-
187
-
188
-
189
-
190
-
191
-
192
-
193
-
194
-
195
-
196
-
197
-
198
-
199
-
200
-
201
-
202
-
203
-
204
-
205
-
206
-
207
-
208
-
209
-
210
-
211
-
212
-
213
-
214
-
215
-
216
-
217
-
218
-
219
-
220
-
221
-
222
-
223
-
224
-
225
-
226
-
227
-
228
-
229
-
230
-
231
-
232
-
233
-
234
-
235
-
236
-
237
-
238
-
239
-
240
-
241
-
242
-
243
-
244
-
245
-
246
-
247
-
248
-
249
-
250
-
251
-
252
-
253
-
254
-
255
-
256
-
257
-
258
-
259
-
260
-
261
-
262
-
263
-
264
-
265
-
266
-
267
-
268
-
269
-
270
-
271
-
272
-
273
-
274
-
275
-
276
-
277
-
278
-
279
-
280
 |
 |

N
OTE
4L
OANS AND
C
OMMITMENTS TO
E
XTEND
C
REDIT
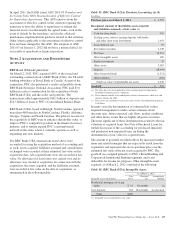
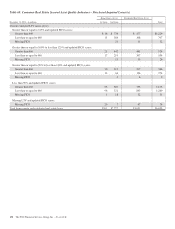
Loans outstanding were as follows:
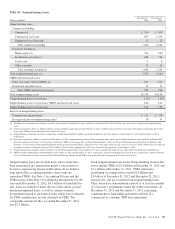
Table 62: Loans Outstanding
In millions
December 31
2012
December 31
2011
Commercial lending
Commercial $ 83,040 $ 65,694
Commercial real estate 18,655 16,204
Equipment lease financing 7,247 6,416
Total Commercial Lending 108,942 88,314
Consumer lending
Home equity 35,920 33,089
Residential real estate 15,240 14,469
Credit card 4,303 3,976
Other consumer 21,451 19,166
Total consumer lending 76,914 70,700
Total loans (a) (b) $185,856 $159,014
(a) Net of unearned income, net deferred loan fees, unamortized discounts and
premiums, and purchase discounts and premiums totaling $2.7 billion and $2.3
billion at December 31, 2012 and December 31, 2011, respectively.
(b) Future accretable yield related to purchased impaired loans is not included in loans
outstanding.
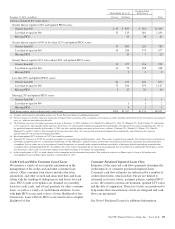
In the normal course of business, we originate or purchase
loan products with contractual features, when concentrated,
that may increase our exposure as a holder of those loan
products. Possible product features that may create a
concentration of credit risk would include a high original or
updated LTV ratio, terms that may expose the borrower to
future increases in repayments above increases in market
interest rates, below-market interest rates and interest-only
loans, among others. We also originate home equity loans and
lines of credit that are concentrated in our primary geographic
markets.
We originate interest-only loans to commercial borrowers.
This is usually to match our borrowers’ asset conversion to
cash expectations (i.e., working capital lines, revolvers).
These products are standard in the financial services industry
and are considered during the underwriting process to mitigate
the increased risk that may result in borrowers not being able
to make interest and principal payments when due. We do not
believe that these product features create a concentration of
credit risk.
At December 31, 2012, we pledged $23.2 billion of commercial
loans to the Federal Reserve Bank and $37.3 billion of
residential real estate and other loans to the Federal Home Loan
Bank as collateral for the contingent ability to borrow, if
necessary. The comparable amounts at December 31, 2011
were $21.8 billion and $27.7 billion, respectively.
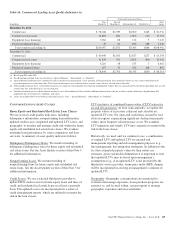
Table 63: Net Unfunded Credit Commitments
In millions
December 31
2012
December 31
2011
Commercial and commercial real
estate $ 78,703 $ 64,955
Home equity lines of credit 19,814 18,317
Credit card 17,381 16,216
Other 4,694 3,783
Total (a) $120,592 $103,271
(a) Excludes standby letters of credit. See Note 24 Commitments and Guarantees for
additional information on standby letters of credit.
Commitments to extend credit represent arrangements to lend
funds or provide liquidity subject to specified contractual
conditions. At December 31, 2012, commercial commitments
reported above exclude $22.5 billion of syndications,
assignments and participations, primarily to financial
institutions. The comparable amount at December 31, 2011
was $20.2 billion.
Commitments generally have fixed expiration dates, may
require payment of a fee, and contain termination clauses in
the event the customer’s credit quality deteriorates. Based on
our historical experience, most commitments expire unfunded,
and therefore cash requirements are substantially less than the
total commitment.
The PNC Financial Services Group, Inc. – Form 10-K 145