PNC Bank 2012 Annual Report Download - page 104
Download and view the complete annual report
Please find page 104 of the 2012 PNC Bank annual report below. You can navigate through the pages in the report by either clicking on the pages listed below, or by using the keyword search tool below to find specific information within the annual report.-
 1
1 -
2
-
3
-
4
-
5
-
6
-
7
-
8
-
9
-
10
-
11
-
12
-
13
-
14
-
15
-
16
-
17
-
18
-
19
-
20
-
21
-
22
-
23
-
24
-
25
-
26
-
27
-
28
-
29
-
30
-
31
-
32
-
33
-
34
-
35
-
36
-
37
-
38
-
39
-
40
-
41
-
42
-
43
-
44
-
45
-
46
-
47
-
48
-
49
-
50
-
51
-
52
-
53
-
54
-
55
-
56
-
57
-
58
-
59
-
60
-
61
-
62
-
63
-
64
-
65
-
66
-
67
-
68
-
69
-
70
-
71
-
72
-
73
-
74
-
75
-
76
-
77
-
78
-
79
-
80
-
81
-
82
-
83
-
84
-
85
-
86
-
87
-
88
-
89
-
90
-
91
-
92
-
93
-
 94
94 -
 95
95 -
 96
96 -
 97
97 -
 98
98 -
 99
99 -
 100
100 -
 101
101 -
 102
102 -
 103
103 -
 104
104 -
 105
105 -
 106
106 -
 107
107 -
 108
108 -
 109
109 -
 110
110 -
 111
111 -
 112
112 -
 113
113 -
 114
114 -
115
-
116
-
117
-
118
-
119
-
120
-
121
-
122
-
123
-
124
-
125
-
126
-
127
-
128
-
129
-
130
-
131
-
132
-
133
-
134
-
135
-
136
-
137
-
138
-
139
-
140
-
141
-
142
-
143
-
144
-
145
-
146
-
147
-
148
-
149
-
150
-
151
-
152
-
153
-
154
-
155
-
156
-
157
-
158
-
159
-
160
-
161
-
162
-
163
-
164
-
165
-
166
-
167
-
168
-
169
-
170
-
171
-
172
-
173
-
174
-
175
-
176
-
177
-
178
-
179
-
180
-
181
-
182
-
183
-
184
-
185
-
186
-
187
-
188
-
189
-
190
-
191
-
192
-
193
-
194
-
195
-
196
-
197
-
198
-
199
-
200
-
201
-
202
-
203
-
204
-
205
-
206
-
207
-
208
-
209
-
210
-
211
-
212
-
213
-
214
-
215
-
216
-
217
-
218
-
219
-
220
-
221
-
222
-
223
-
224
-
225
-
226
-
227
-
228
-
229
-
230
-
231
-
232
-
233
-
234
-
235
-
236
-
237
-
238
-
239
-
240
-
241
-
242
-
243
-
244
-
245
-
246
-
247
-
248
-
249
-
250
-
251
-
252
-
253
-
254
-
255
-
256
-
257
-
258
-
259
-
260
-
261
-
262
-
263
-
264
-
265
-
266
-
267
-
268
-
269
-
270
-
271
-
272
-
273
-
274
-
275
-
276
-
277
-
278
-
279
-
280
 |
 |
C
REDIT
R
ISK
M
ANAGEMENT
Credit risk represents the possibility that a customer,
counterparty or issuer may not perform in accordance with
contractual terms. Credit risk is inherent in the financial
services business and results from extending credit to
customers, purchasing securities, and entering into financial
derivative transactions and certain guarantee contracts. Credit
risk is one of our most significant risks. Our processes for
managing credit risk are embedded in PNC’s risk culture and
in our decision-making processes using a systematic approach
whereby credit risks and related exposures are: identified and
assessed; managed through specific policies and processes;
measured and evaluated against our risk tolerance limits; and
reported, along with specific mitigation activities, to
management and the board through our governance structure.
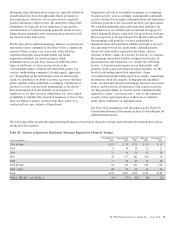
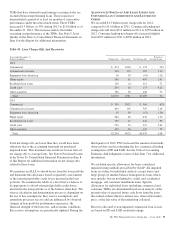
Asset Quality Overview
Overall asset quality trends in 2012 improved from
December 31, 2011 and included the following:
• Nonperforming loans decreased $306 million, or 9%,
to $3.3 billion as of December 31, 2012 compared
with $3.6 billion as of December 31, 2011. This
decrease was mainly attributable to decreases in
commercial real estate and commercial
nonperforming loans, which were partially offset by
the acquisition of RBC Bank (USA) and higher
nonperforming consumer loans. Pursuant to
regulatory guidance issued in the third quarter of
2012, nonperforming consumer loans, primarily
home equity and residential mortgage, increased
$288 million in 2012 related to changes in treatment
of certain loans classified as TDRs, net of charge-
offs, resulting from bankruptcy where no formal
reaffirmation was provided by the borrower and
therefore a concession has been granted based upon
discharge from personal liability. Of these loans,
approximately 78% were current on their payments at
December 31, 2012. Additionally, nonperforming
home equity loans increased due to a change in
policy made in the first quarter of 2012 which places
home equity loans on nonaccrual status when past
due 90 days or more compared with 180 days under
the prior policy.
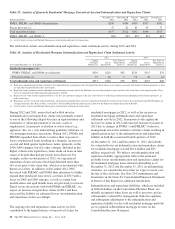
• Overall loan delinquencies decreased $797 million,
or 18%, from year-end 2011. The reduction was
mainly due to a decline in government insured
residential real estate loans in addition to a first
quarter of 2012 policy change for home equity loans
whereby loans are placed on nonaccrual status when
past due 90 days compared to prior policy of placing
loans on nonaccrual status when past due 180 days.
In addition, consumer loan delinquencies, primarily
residential real estate delinquencies, decreased
pursuant to regulatory guidance issued in the third
quarter of 2012 related to treatment of certain loans
classified as TDRs resulting from bankruptcy as
discussed above. These decreases were partially
offset by an increase in commercial real estate
delinquencies.
• Net charge-offs were $1.3 billion in 2012, down 21%
from 2011 net charge-offs of $1.6 billion. Pursuant to
regulatory guidance issued in the third quarter of
2012, additional consumer charge-offs of $128.1
million have been taken in 2012 related to changes in
treatment of certain loans where borrowers have been
discharged from personal liability under bankruptcy
protection where no formal reaffirmation was
provided by the borrower. Such loans have been
classified as TDRs and have been measured at the
fair value of the collateral less costs to sell.
• The provision for credit losses declined 14% to $1.0
billion for 2012 compared with $1.2 billion for 2011.
• The level of ALLL decreased 7% to $4.0 billion at
December 31, 2012 from $4.3 billion at
December 31, 2011.
The PNC Financial Services Group, Inc. – Form 10-K 85