PNC Bank 2012 Annual Report Download - page 190
Download and view the complete annual report
Please find page 190 of the 2012 PNC Bank annual report below. You can navigate through the pages in the report by either clicking on the pages listed below, or by using the keyword search tool below to find specific information within the annual report.-
 1
1 -
2
-
3
-
4
-
5
-
6
-
7
-
8
-
9
-
10
-
11
-
12
-
13
-
14
-
15
-
16
-
17
-
18
-
19
-
20
-
21
-
22
-
23
-
24
-
25
-
26
-
27
-
28
-
29
-
30
-
31
-
32
-
33
-
34
-
35
-
36
-
37
-
38
-
39
-
40
-
41
-
42
-
43
-
44
-
45
-
46
-
47
-
48
-
49
-
50
-
51
-
52
-
53
-
54
-
55
-
56
-
57
-
58
-
59
-
60
-
61
-
62
-
63
-
64
-
65
-
66
-
67
-
68
-
69
-
70
-
71
-
72
-
73
-
74
-
75
-
76
-
77
-
78
-
79
-
80
-
81
-
82
-
83
-
84
-
85
-
86
-
87
-
88
-
89
-
90
-
91
-
92
-
93
-
94
-
95
-
96
-
97
-
98
-
99
-
100
-
101
-
102
-
103
-
104
-
105
-
106
-
107
-
108
-
109
-
110
-
111
-
112
-
113
-
114
-
115
-
116
-
117
-
118
-
119
-
120
-
121
-
122
-
123
-
124
-
125
-
126
-
127
-
128
-
129
-
130
-
131
-
132
-
133
-
134
-
135
-
136
-
137
-
138
-
139
-
140
-
141
-
142
-
143
-
144
-
145
-
146
-
147
-
148
-
149
-
150
-
151
-
152
-
153
-
154
-
155
-
156
-
157
-
158
-
159
-
160
-
161
-
162
-
163
-
164
-
165
-
166
-
167
-
168
-
169
-
170
-
171
-
172
-
173
-
174
-
175
-
176
-
177
-
178
-
179
-
 180
180 -
 181
181 -
 182
182 -
 183
183 -
 184
184 -
 185
185 -
 186
186 -
 187
187 -
 188
188 -
 189
189 -
 190
190 -
 191
191 -
 192
192 -
 193
193 -
 194
194 -
 195
195 -
 196
196 -
 197
197 -
 198
198 -
 199
199 -
 200
200 -
201
-
202
-
203
-
204
-
205
-
206
-
207
-
208
-
209
-
210
-
211
-
212
-
213
-
214
-
215
-
216
-
217
-
218
-
219
-
220
-
221
-
222
-
223
-
224
-
225
-
226
-
227
-
228
-
229
-
230
-
231
-
232
-
233
-
234
-
235
-
236
-
237
-
238
-
239
-
240
-
241
-
242
-
243
-
244
-
245
-
246
-
247
-
248
-
249
-
250
-
251
-
252
-
253
-
254
-
255
-
256
-
257
-
258
-
259
-
260
-
261
-
262
-
263
-
264
-
265
-
266
-
267
-
268
-
269
-
270
-
271
-
272
-
273
-
274
-
275
-
276
-
277
-
278
-
279
-
280
 |
 |

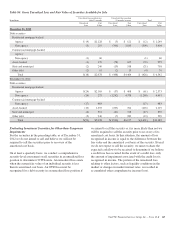
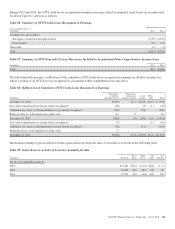
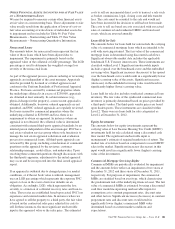
Based on current interest rates and expected prepayment
speeds, the weighted-average expected maturity of mortgage
and other asset-backed debt securities were as follows as of
December 31, 2012:
Table 91: Weighted-Average Expected Maturity of Mortgage
and Other Asset-Backed Debt Securities
December 31
2012
Agency residential mortgage-backed securities 3.3 years
Non-agency residential mortgage-backed securities 5.4 years
Agency commercial mortgage-backed securities 4.7 years
Non-agency commercial mortgage-backed securities 2.6 years
Asset-backed securities 4.1 years
Weighted-average yields are based on historical cost with
effective yields weighted for the contractual maturity of each
security. At December 31, 2012, there were no securities of a
single issuer, other than FNMA and FHLMC, which exceeded
10% of total shareholders’ equity.
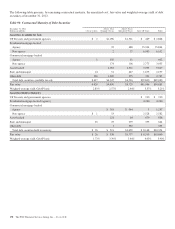
The following table presents the fair value of securities that
have been either pledged to or accepted from others to
collateralize outstanding borrowings.
Table 92: Fair Value of Securities Pledged and Accepted as
Collateral
In millions
December 31
2012
December 31
2011
Pledged to others $25,648 $20,109
Accepted from others:
Permitted by contract or custom to
sell or repledge 1,015 1,796
Permitted amount repledged to
others 685 892
The securities pledged to others include positions held in our
portfolio of investment securities, trading securities, and
securities accepted as collateral from others that we are
permitted by contract or custom to sell or repledge, and were
used to secure public and trust deposits, repurchase
agreements, and for other purposes. The securities accepted
from others that we are permitted by contract or custom to sell
or repledge are a component of Federal funds sold and resale
agreements on our Consolidated Balance Sheet.
N
OTE
9F
AIR
V
ALUE
F
AIR
V
ALUE
M
EASUREMENT
Fair value is defined in GAAP as the price that would be
received to sell an asset or the price that would be paid to
transfer a liability on the measurement date. The standard
focuses on the exit price in the principal or most advantageous
market for the asset or liability in an orderly transaction
between market participants. GAAP establishes a fair value
reporting hierarchy to maximize the use of observable inputs
when measuring fair value and defines the three levels of
inputs as noted below.
Level 1
Fair value is determined using a quoted price in an active
market for identical assets or liabilities. Level 1 assets and
liabilities may include debt securities, equity securities and
listed derivative contracts that are traded in an active exchange
market and certain US Treasury securities that are actively
traded in over-the-counter markets.
Level 2
Fair value is estimated using inputs other than quoted prices
included within Level 1 that are observable for assets or
liabilities, either directly or indirectly. Level 2 assets and
liabilities may include debt securities, equity securities and
listed derivative contracts with quoted prices that are traded in
markets that are not active, and certain debt and equity
securities and over-the-counter derivative contracts whose fair
value is determined using a pricing model without significant
unobservable inputs. This category generally includes US
government agency debt securities, agency residential and
commercial mortgage-backed debt securities, asset-backed
debt securities, corporate debt securities, residential mortgage
loans held for sale, corporate trading loans and derivative
contracts.
Level 3
Fair value is estimated using unobservable inputs that are
significant to the fair value of the assets or liabilities. Level 3
assets and liabilities may include financial instruments whose
value is determined using pricing services, pricing models
with internally developed assumptions, discounted cash flow
methodologies, or similar techniques, as well as instruments
for which the determination of fair value requires significant
management judgment or estimation. This category generally
includes certain available for sale and trading securities,
commercial mortgage loans held for sale, certain residential
mortgage loans and loans held for sale, private equity
investments, residential mortgage servicing rights, BlackRock
Series C Preferred Stock and certain financial derivative
contracts. The available for sale and trading securities within
Level 3 include non-agency residential mortgage-backed
securities, auction rate securities, certain private-issuer asset-
backed securities and corporate debt securities. Assets which
have been adjusted due to impairment are accounted for at fair
value on a nonrecurring basis and consist primarily of certain
The PNC Financial Services Group, Inc. – Form 10-K 171