PNC Bank 2012 Annual Report Download - page 218
Download and view the complete annual report
Please find page 218 of the 2012 PNC Bank annual report below. You can navigate through the pages in the report by either clicking on the pages listed below, or by using the keyword search tool below to find specific information within the annual report.-
 1
1 -
2
-
3
-
4
-
5
-
6
-
7
-
8
-
9
-
10
-
11
-
12
-
13
-
14
-
15
-
16
-
17
-
18
-
19
-
20
-
21
-
22
-
23
-
24
-
25
-
26
-
27
-
28
-
29
-
30
-
31
-
32
-
33
-
34
-
35
-
36
-
37
-
38
-
39
-
40
-
41
-
42
-
43
-
44
-
45
-
46
-
47
-
48
-
49
-
50
-
51
-
52
-
53
-
54
-
55
-
56
-
57
-
58
-
59
-
60
-
61
-
62
-
63
-
64
-
65
-
66
-
67
-
68
-
69
-
70
-
71
-
72
-
73
-
74
-
75
-
76
-
77
-
78
-
79
-
80
-
81
-
82
-
83
-
84
-
85
-
86
-
87
-
88
-
89
-
90
-
91
-
92
-
93
-
94
-
95
-
96
-
97
-
98
-
99
-
100
-
101
-
102
-
103
-
104
-
105
-
106
-
107
-
108
-
109
-
110
-
111
-
112
-
113
-
114
-
115
-
116
-
117
-
118
-
119
-
120
-
121
-
122
-
123
-
124
-
125
-
126
-
127
-
128
-
129
-
130
-
131
-
132
-
133
-
134
-
135
-
136
-
137
-
138
-
139
-
140
-
141
-
142
-
143
-
144
-
145
-
146
-
147
-
148
-
149
-
150
-
151
-
152
-
153
-
154
-
155
-
156
-
157
-
158
-
159
-
160
-
161
-
162
-
163
-
164
-
165
-
166
-
167
-
168
-
169
-
170
-
171
-
172
-
173
-
174
-
175
-
176
-
177
-
178
-
179
-
180
-
181
-
182
-
183
-
184
-
185
-
186
-
187
-
188
-
189
-
190
-
191
-
192
-
193
-
194
-
195
-
196
-
197
-
198
-
199
-
200
-
201
-
202
-
203
-
204
-
205
-
206
-
207
-
 208
208 -
 209
209 -
 210
210 -
 211
211 -
 212
212 -
 213
213 -
 214
214 -
 215
215 -
 216
216 -
 217
217 -
 218
218 -
 219
219 -
 220
220 -
 221
221 -
 222
222 -
 223
223 -
 224
224 -
 225
225 -
 226
226 -
 227
227 -
 228
228 -
229
-
230
-
231
-
232
-
233
-
234
-
235
-
236
-
237
-
238
-
239
-
240
-
241
-
242
-
243
-
244
-
245
-
246
-
247
-
248
-
249
-
250
-
251
-
252
-
253
-
254
-
255
-
256
-
257
-
258
-
259
-
260
-
261
-
262
-
263
-
264
-
265
-
266
-
267
-
268
-
269
-
270
-
271
-
272
-
273
-
274
-
275
-
276
-
277
-
278
-
279
-
280
 |
 |

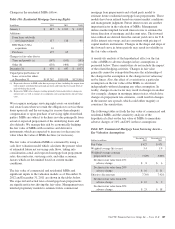
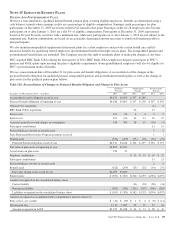
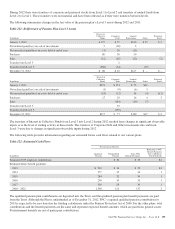
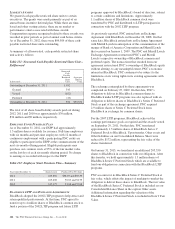
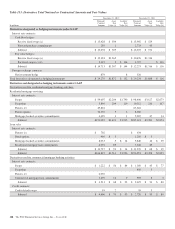
During 2012 there were transfers of corporate and preferred stocks from Level 1 to Level 2 and transfers of mutual funds from
Level 2 to Level 1. These transfers were not material and have been reflected as if they were transfers between levels.
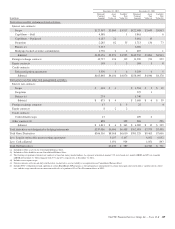
The following summarizes changes in the fair value of the pension plan’s Level 3 assets during 2012 and 2011.
Table 121: Rollforward of Pension Plan Level 3 Assets
In millions
Interest in
Collective
Funds
Corporate
Debt
Limited
Partnerships Other
Preferred
Stock
January 1, 2012 $ 377 $ 77 $130 $ 27 $ 2
Net realized gain/(loss) on sale of investments 5 (28) 2
Net unrealized gain/(loss) on assets held at end of year (3) 20 (13)
Purchases 89 30 30
Sales (12) (65) (22) (2)
Transfers into Level 3 2
Transfers from Level 3 (368) (14) (27)
December 31, 2012 $ 88 $ 22 $127 $ – $ –
In millions
Interest in
Collective
Funds
Corporate
Debt
Limited
Partnerships Other
Preferred
Stock
January 1, 2011 $370 $ 353 $ 75 $31
Net realized gain/(loss) on sale of investments (1) (9) (6) 3
Net unrealized gain/(loss) on assets held at end of year (19) (12) 55 (4) $(1)
Purchases 27 29 16 4 3
Sales (184) (10) (7)
Transfers into Level 3 30
Transfers from Level 3 (130)
December 31, 2011 $377 $ 77 $130 $27 $ 2
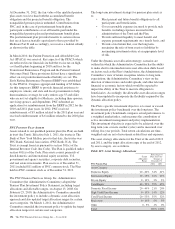
The transfers of Interest in Collective Funds from Level 3 into Level 2 during 2012 resulted from changes in significant observable
inputs as to the level of trading activity in these funds. The transfers of Corporate Debt and Other investments into and from
Level 3 were due to changes in significant observable inputs during 2012.
The following table provides information regarding our estimated future cash flows related to our various plans.
Table 122: Estimated Cash Flows
Postretirement Benefits
In millions
Qualified
Pension
Nonqualified
Pension
Gross PNC
Benefit Payments
Reduction in PNC
Benefit Payments
Due to Medicare
Part D Subsidy
Estimated 2013 employer contributions $ 36 $ 29 $1
Estimated future benefit payments
2013 $ 263 $ 36 $ 29 $1
2014 277 35 34 1
2015 284 32 30 1
2016 290 30 30 1
2017 303 29 30 1
2018 – 2022 1,598 121 137 3
The qualified pension plan contributions are deposited into the Trust, and the qualified pension plan benefit payments are paid
from the Trust. Although the Plan is underfunded as of December 31, 2012, PNC’s required qualified pension contribution for
2013 is expected to be zero based on the funding calculations under the Pension Protection Act of 2006. For the other plans, total
contributions and the benefit payments are the same and represent expected benefit amounts, which are paid from general assets.
Postretirement benefits are net of participant contributions.
The PNC Financial Services Group, Inc. – Form 10-K 199