PNC Bank 2012 Annual Report Download - page 138
Download and view the complete annual report
Please find page 138 of the 2012 PNC Bank annual report below. You can navigate through the pages in the report by either clicking on the pages listed below, or by using the keyword search tool below to find specific information within the annual report.-
 1
1 -
2
-
3
-
4
-
5
-
6
-
7
-
8
-
9
-
10
-
11
-
12
-
13
-
14
-
15
-
16
-
17
-
18
-
19
-
20
-
21
-
22
-
23
-
24
-
25
-
26
-
27
-
28
-
29
-
30
-
31
-
32
-
33
-
34
-
35
-
36
-
37
-
38
-
39
-
40
-
41
-
42
-
43
-
44
-
45
-
46
-
47
-
48
-
49
-
50
-
51
-
52
-
53
-
54
-
55
-
56
-
57
-
58
-
59
-
60
-
61
-
62
-
63
-
64
-
65
-
66
-
67
-
68
-
69
-
70
-
71
-
72
-
73
-
74
-
75
-
76
-
77
-
78
-
79
-
80
-
81
-
82
-
83
-
84
-
85
-
86
-
87
-
88
-
89
-
90
-
91
-
92
-
93
-
94
-
95
-
96
-
97
-
98
-
99
-
100
-
101
-
102
-
103
-
104
-
105
-
106
-
107
-
108
-
109
-
110
-
111
-
112
-
113
-
114
-
115
-
116
-
117
-
118
-
119
-
120
-
121
-
122
-
123
-
124
-
125
-
126
-
127
-
 128
128 -
 129
129 -
 130
130 -
 131
131 -
 132
132 -
 133
133 -
 134
134 -
 135
135 -
 136
136 -
 137
137 -
 138
138 -
 139
139 -
 140
140 -
 141
141 -
 142
142 -
 143
143 -
 144
144 -
 145
145 -
 146
146 -
 147
147 -
 148
148 -
149
-
150
-
151
-
152
-
153
-
154
-
155
-
156
-
157
-
158
-
159
-
160
-
161
-
162
-
163
-
164
-
165
-
166
-
167
-
168
-
169
-
170
-
171
-
172
-
173
-
174
-
175
-
176
-
177
-
178
-
179
-
180
-
181
-
182
-
183
-
184
-
185
-
186
-
187
-
188
-
189
-
190
-
191
-
192
-
193
-
194
-
195
-
196
-
197
-
198
-
199
-
200
-
201
-
202
-
203
-
204
-
205
-
206
-
207
-
208
-
209
-
210
-
211
-
212
-
213
-
214
-
215
-
216
-
217
-
218
-
219
-
220
-
221
-
222
-
223
-
224
-
225
-
226
-
227
-
228
-
229
-
230
-
231
-
232
-
233
-
234
-
235
-
236
-
237
-
238
-
239
-
240
-
241
-
242
-
243
-
244
-
245
-
246
-
247
-
248
-
249
-
250
-
251
-
252
-
253
-
254
-
255
-
256
-
257
-
258
-
259
-
260
-
261
-
262
-
263
-
264
-
265
-
266
-
267
-
268
-
269
-
270
-
271
-
272
-
273
-
274
-
275
-
276
-
277
-
278
-
279
-
280
 |
 |

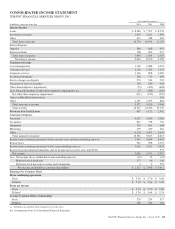
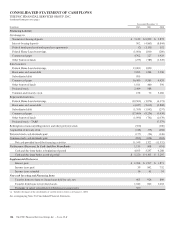
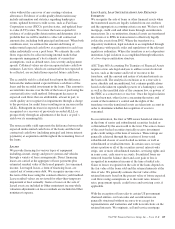
CONSOLIDATED INCOME STATEMENT
THE PNC FINANCIAL SERVICES GROUP, INC.
Year ended December 31
In millions, except per share data 2012 2011 2010
Interest Income
Loans $ 8,284 $ 7,595 $ 8,276
Investment securities 2,035 2,161 2,389
Other 415 438 485
Total interest income 10,734 10,194 11,150
Interest Expense
Deposits 386 668 963
Borrowed funds 708 826 957
Total interest expense 1,094 1,494 1,920
Net interest income 9,640 8,700 9,230
Noninterest Income
Asset management 1,169 1,088 1,054
Consumer services 1,136 1,243 1,261
Corporate services 1,166 898 1,082
Residential mortgage 284 713 699
Service charges on deposits 573 534 705
Net gains on sales of securities 204 249 426
Other-than-temporary impairments (79) (420) (608)
Less: Noncredit portion of other-than-temporary impairments (a) 32 (268) (283)
Net other-than-temporary impairments (111) (152) (325)
Gains on BlackRock transactions 160
Other 1,451 1,053 884
Total noninterest income 5,872 5,626 5,946
Total revenue 15,512 14,326 15,176
Provision For Credit Losses 987 1,152 2,502
Noninterest Expense
Personnel 4,617 3,966 3,906
Occupancy 827 738 730
Equipment 735 661 668
Marketing 279 249 266
Other 4,124 3,491 3,043
Total noninterest expense 10,582 9,105 8,613
Income from continuing operations before income taxes and noncontrolling interests 3,943 4,069 4,061
Income taxes 942 998 1,037
Income from continuing operations before noncontrolling interests 3,001 3,071 3,024
Income from discontinued operations (net of income taxes of zero, zero, and $338) 373
Net income 3,001 3,071 3,397
Less: Net income (loss) attributable to noncontrolling interests (12) 15 (15)
Preferred stock dividends 177 56 146
Preferred stock discount accretion and redemptions 4 2 255
Net income attributable to common shareholders $ 2,832 $ 2,998 $ 3,011
Earnings Per Common Share
From continuing operations
Basic $ 5.36 $ 5.70 $ 5.08
Diluted $ 5.30 $ 5.64 $ 5.02
From net income
Basic $ 5.36 $ 5.70 $ 5.80
Diluted $ 5.30 $ 5.64 $ 5.74
Average Common Shares Outstanding
Basic 526 524 517
Diluted 529 526 520
(a) Included in accumulated other comprehensive income (loss).
See accompanying Notes To Consolidated Financial Statements.
The PNC Financial Services Group, Inc. – Form 10-K 119