PNC Bank 2012 Annual Report Download - page 54
Download and view the complete annual report
Please find page 54 of the 2012 PNC Bank annual report below. You can navigate through the pages in the report by either clicking on the pages listed below, or by using the keyword search tool below to find specific information within the annual report.-
 1
1 -
2
-
3
-
4
-
5
-
6
-
7
-
8
-
9
-
10
-
11
-
12
-
13
-
14
-
15
-
16
-
17
-
18
-
19
-
20
-
21
-
22
-
23
-
24
-
25
-
26
-
27
-
28
-
29
-
30
-
31
-
32
-
33
-
34
-
35
-
36
-
37
-
38
-
39
-
40
-
41
-
42
-
43
-
 44
44 -
 45
45 -
 46
46 -
 47
47 -
 48
48 -
 49
49 -
 50
50 -
 51
51 -
 52
52 -
 53
53 -
 54
54 -
 55
55 -
 56
56 -
 57
57 -
 58
58 -
 59
59 -
 60
60 -
 61
61 -
 62
62 -
 63
63 -
 64
64 -
65
-
66
-
67
-
68
-
69
-
70
-
71
-
72
-
73
-
74
-
75
-
76
-
77
-
78
-
79
-
80
-
81
-
82
-
83
-
84
-
85
-
86
-
87
-
88
-
89
-
90
-
91
-
92
-
93
-
94
-
95
-
96
-
97
-
98
-
99
-
100
-
101
-
102
-
103
-
104
-
105
-
106
-
107
-
108
-
109
-
110
-
111
-
112
-
113
-
114
-
115
-
116
-
117
-
118
-
119
-
120
-
121
-
122
-
123
-
124
-
125
-
126
-
127
-
128
-
129
-
130
-
131
-
132
-
133
-
134
-
135
-
136
-
137
-
138
-
139
-
140
-
141
-
142
-
143
-
144
-
145
-
146
-
147
-
148
-
149
-
150
-
151
-
152
-
153
-
154
-
155
-
156
-
157
-
158
-
159
-
160
-
161
-
162
-
163
-
164
-
165
-
166
-
167
-
168
-
169
-
170
-
171
-
172
-
173
-
174
-
175
-
176
-
177
-
178
-
179
-
180
-
181
-
182
-
183
-
184
-
185
-
186
-
187
-
188
-
189
-
190
-
191
-
192
-
193
-
194
-
195
-
196
-
197
-
198
-
199
-
200
-
201
-
202
-
203
-
204
-
205
-
206
-
207
-
208
-
209
-
210
-
211
-
212
-
213
-
214
-
215
-
216
-
217
-
218
-
219
-
220
-
221
-
222
-
223
-
224
-
225
-
226
-
227
-
228
-
229
-
230
-
231
-
232
-
233
-
234
-
235
-
236
-
237
-
238
-
239
-
240
-
241
-
242
-
243
-
244
-
245
-
246
-
247
-
248
-
249
-
250
-
251
-
252
-
253
-
254
-
255
-
256
-
257
-
258
-
259
-
260
-
261
-
262
-
263
-
264
-
265
-
266
-
267
-
268
-
269
-
270
-
271
-
272
-
273
-
274
-
275
-
276
-
277
-
278
-
279
-
280
 |
 |

K
EY
F
ACTORS
A
FFECTING
F
INANCIAL
P
ERFORMANCE
Our financial performance is substantially affected by a
number of external factors outside of our control, including
the following:
• General economic conditions, including the
continuity, speed and stamina of the moderate
economic recovery in general and on our customers
in particular,
• The level of, and direction, timing and magnitude of
movement in, interest rates and the shape of the
interest rate yield curve,
• The functioning and other performance of, and
availability of liquidity in, the capital and other
financial markets,
• Loan demand, utilization of credit commitments and
standby letters of credit, and asset quality,
• Customer demand for non-loan products and
services,
• Changes in the competitive and regulatory landscape
and in counterparty creditworthiness and
performance as the financial services industry
restructures in the current environment,
• The impact of the extensive reforms enacted in the
Dodd-Frank legislation and other legislative,
regulatory and administrative initiatives, including
those outlined elsewhere in this Report, and
• The impact of market credit spreads on asset
valuations.
In addition, our success will depend upon, among other things:
• Further success in growing profitability through the
acquisition and retention of customers,
• Continued development of the geographic markets
related to our recent acquisitions, including full
deployment of our product offerings into our
Southeast markets,
• Revenue growth and our ability to provide innovative
and valued products to our customers,
• Our ability to utilize technology to develop and
deliver products and services to our customers,
• Our ability to manage and implement strategic
business objectives within the changing regulatory
environment,
• A sustained focus on expense management,
• Managing the non-strategic assets portfolio and
impaired assets,
• Improving our overall asset quality,
• Continuing to maintain and grow our deposit base as
a low-cost funding source,
• Prudent risk and capital management related to our
efforts to manage risk in keeping with a moderate
risk philosophy, and to meet evolving regulatory
capital standards,
• Actions we take within the capital and other financial
markets,
• The impact of legal and regulatory-related
contingencies, and
• The appropriateness of reserves needed for critical
estimates and related contingencies.
For additional information, please see Risk Factors in Item 1A
of this Report and the Cautionary Statement Regarding
Forward-Looking Information section in this Item 7.
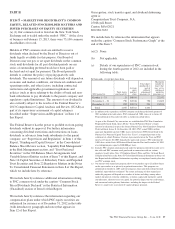
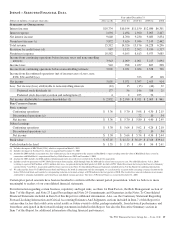
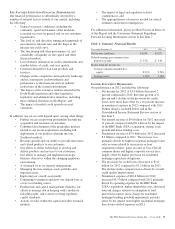
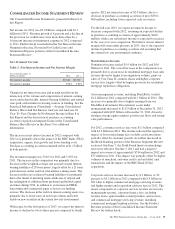
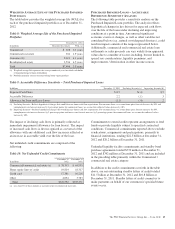
Table 1: Summary Financial Results
Year ended December 31 2012 2011
Net income (millions) $3,001 $3,071
Diluted earnings per common share
from net income $ 5.30 $ 5.64
Return from net income on:
Average common shareholders’
equity 8.31% 9.56%
Average assets 1.02% 1.16%
I
NCOME
S
TATEMENT
H
IGHLIGHTS
Our performance in 2012 included the following:
• Net income for 2012 of $3.0 billion decreased 2
percent compared to 2011. Revenue growth of 8
percent and a decline in the provision for credit
losses were more than offset by a 16 percent increase
in noninterest expense in 2012 compared with 2011.
Further detail is included below and in the
Consolidated Income Statement Review section of
this Item 7.
• Net interest income of $9.6 billion for 2012 increased
11 percent compared with 2011 driven by the impact
of the RBC Bank (USA) acquisition, organic loan
growth and lower funding costs.
• Noninterest income of $5.9 billion for 2012 increased
$.2 billion compared to 2011. The increase was
primarily driven by higher residential mortgage loans
sales revenue related to an increase in loan
origination volume, gains on sales of Visa Class B
common shares and higher corporate service fees,
largely offset by higher provision for residential
mortgage repurchase obligations.
• The provision for credit losses decreased to $1.0
billion for 2012 compared to $1.2 billion for 2011.
The decline in the comparison was driven by overall
credit quality improvement.
• Noninterest expense of $10.6 billion for 2012
increased $1.5 billion compared with 2011 primarily
driven by operating expense for the RBC Bank
(USA) acquisition, higher integration costs, increased
noncash charges related to redemption of trust
preferred securities and a charge for residential
mortgage banking goodwill impairment, partially
offset by the impact from higher residential mortgage
foreclosure-related expenses in 2011.
The PNC Financial Services Group, Inc. – Form 10-K 35