PNC Bank 2012 Annual Report Download - page 208
Download and view the complete annual report
Please find page 208 of the 2012 PNC Bank annual report below. You can navigate through the pages in the report by either clicking on the pages listed below, or by using the keyword search tool below to find specific information within the annual report.-
 1
1 -
2
-
3
-
4
-
5
-
6
-
7
-
8
-
9
-
10
-
11
-
12
-
13
-
14
-
15
-
16
-
17
-
18
-
19
-
20
-
21
-
22
-
23
-
24
-
25
-
26
-
27
-
28
-
29
-
30
-
31
-
32
-
33
-
34
-
35
-
36
-
37
-
38
-
39
-
40
-
41
-
42
-
43
-
44
-
45
-
46
-
47
-
48
-
49
-
50
-
51
-
52
-
53
-
54
-
55
-
56
-
57
-
58
-
59
-
60
-
61
-
62
-
63
-
64
-
65
-
66
-
67
-
68
-
69
-
70
-
71
-
72
-
73
-
74
-
75
-
76
-
77
-
78
-
79
-
80
-
81
-
82
-
83
-
84
-
85
-
86
-
87
-
88
-
89
-
90
-
91
-
92
-
93
-
94
-
95
-
96
-
97
-
98
-
99
-
100
-
101
-
102
-
103
-
104
-
105
-
106
-
107
-
108
-
109
-
110
-
111
-
112
-
113
-
114
-
115
-
116
-
117
-
118
-
119
-
120
-
121
-
122
-
123
-
124
-
125
-
126
-
127
-
128
-
129
-
130
-
131
-
132
-
133
-
134
-
135
-
136
-
137
-
138
-
139
-
140
-
141
-
142
-
143
-
144
-
145
-
146
-
147
-
148
-
149
-
150
-
151
-
152
-
153
-
154
-
155
-
156
-
157
-
158
-
159
-
160
-
161
-
162
-
163
-
164
-
165
-
166
-
167
-
168
-
169
-
170
-
171
-
172
-
173
-
174
-
175
-
176
-
177
-
178
-
179
-
180
-
181
-
182
-
183
-
184
-
185
-
186
-
187
-
188
-
189
-
190
-
191
-
192
-
193
-
194
-
195
-
196
-
197
-
 198
198 -
 199
199 -
 200
200 -
 201
201 -
 202
202 -
 203
203 -
 204
204 -
 205
205 -
 206
206 -
 207
207 -
 208
208 -
 209
209 -
 210
210 -
 211
211 -
 212
212 -
 213
213 -
 214
214 -
 215
215 -
 216
216 -
 217
217 -
 218
218 -
219
-
220
-
221
-
222
-
223
-
224
-
225
-
226
-
227
-
228
-
229
-
230
-
231
-
232
-
233
-
234
-
235
-
236
-
237
-
238
-
239
-
240
-
241
-
242
-
243
-
244
-
245
-
246
-
247
-
248
-
249
-
250
-
251
-
252
-
253
-
254
-
255
-
256
-
257
-
258
-
259
-
260
-
261
-
262
-
263
-
264
-
265
-
266
-
267
-
268
-
269
-
270
-
271
-
272
-
273
-
274
-
275
-
276
-
277
-
278
-
279
-
280
 |
 |

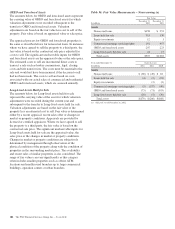
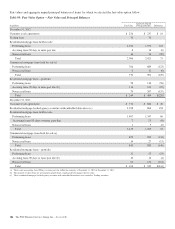
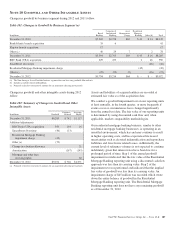
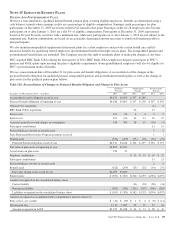
Changes in the residential MSRs follow:
Table 106: Residential Mortgage Servicing Rights
In millions 2012 2011 2010
January 1 $ 647 $ 1,033 $ 1,332
Additions:
From loans sold with
servicing retained 117 118 95
RBC Bank (USA)
acquisition 16
Purchases 175 65
Changes in fair value due to:
Time and payoffs (a) (167) (163) (185)
Other (b) (138) (406) (209)
December 31 $ 650 $ 647 $ 1,033
Unpaid principal balance of
loans serviced for others
at December 31 $119,262 $118,058 $125,806
(a) Represents decrease in MSR value due to passage of time, including the impact from
both regularly scheduled loan principal payments and loans that were paid down or
paid off during the period.
(b) Represents MSR value changes resulting primarily from market-driven changes in
interest rates, as well as changes in assumptions such as prepayments and servicing
costs.
We recognize mortgage servicing right assets on residential
real estate loans when we retain the obligation to service these
loans upon sale and the servicing fee is more than adequate
compensation or upon purchase of servicing rights from third
parties. MSRs are subject to declines in value principally from
actual or expected prepayment of the underlying loans and
also defaults. We manage this risk by economically hedging
the fair value of MSRs with securities and derivative
instruments which are expected to increase (or decrease) in
value when the value of MSRs declines (or increases).
The fair value of residential MSRs is estimated by using a
cash flow valuation model which calculates the present value
of estimated future net servicing cash flows, taking into
consideration actual and expected mortgage loan prepayment
rates, discount rates, servicing costs, and other economic
factors which are determined based on current market
conditions.
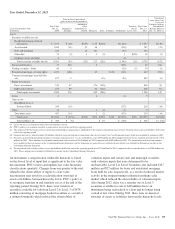
The fair value of commercial and residential MSRs and
significant inputs to the valuation models as of December 31,
2012 and December 31, 2011 are shown in the tables below.
The expected and actual rates of mortgage loan prepayments
are significant factors driving the fair value. Management uses
internal proprietary models to estimate future commercial
mortgage loan prepayments and a third party model to
estimate future residential mortgage loan prepayments. These
models have been refined based on current market conditions
and management judgment. Future interest rates are another
important factor in the valuation of MSRs. Management
utilizes market implied forward interest rates to estimate the
future direction of mortgage and discount rates. The forward
rates utilized are derived from the current yield curve for U.S.
dollar interest rate swaps and are consistent with pricing of
capital markets instruments. Changes in the shape and slope of
the forward curve in future periods may result in volatility in
the fair value estimate.
A sensitivity analysis of the hypothetical effect on the fair
value of MSRs to adverse changes in key assumptions is
presented below. These sensitivities do not include the impact
of the related hedging activities. Changes in fair value
generally cannot be extrapolated because the relationship of
the change in the assumption to the change in fair value may
not be linear. Also, the effect of a variation in a particular
assumption on the fair value of the MSRs is calculated
independently without changing any other assumption. In
reality, changes in one factor may result in changes in another
(for example, changes in mortgage interest rates, which drive
changes in prepayment rate estimates, could result in changes
in the interest rate spread), which could either magnify or
counteract the sensitivities.
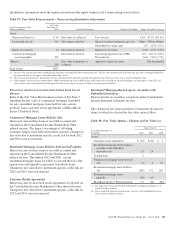
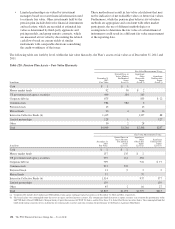
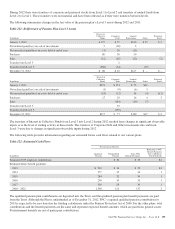
The following tables set forth the fair value of commercial and
residential MSRs and the sensitivity analysis of the
hypothetical effect on the fair value of MSRs to immediate
adverse changes of 10% and 20% in those assumptions:
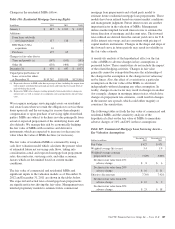
Table 107: Commercial Mortgage Loan Servicing Assets –
Key Valuation Assumptions
Dollars in millions
December 31
2012
December 31
2011
Fair Value $ 427 $ 471
Weighted-average life (years) 5.4 5.9
Weighted-average constant
prepayment rate 7.63% 5.08%
Decline in fair value from 10%
adverse change $ 8 $ 6
Decline in fair value from 20%
adverse change $ 16 $ 11
Effective discount rate 7.70% 7.92%
Decline in fair value from 10%
adverse change $ 12 $ 9
Decline in fair value from 20%
adverse change $ 23 $ 18
The PNC Financial Services Group, Inc. – Form 10-K 189