PNC Bank 2012 Annual Report Download - page 253
Download and view the complete annual report
Please find page 253 of the 2012 PNC Bank annual report below. You can navigate through the pages in the report by either clicking on the pages listed below, or by using the keyword search tool below to find specific information within the annual report.-
 1
1 -
2
-
3
-
4
-
5
-
6
-
7
-
8
-
9
-
10
-
11
-
12
-
13
-
14
-
15
-
16
-
17
-
18
-
19
-
20
-
21
-
22
-
23
-
24
-
25
-
26
-
27
-
28
-
29
-
30
-
31
-
32
-
33
-
34
-
35
-
36
-
37
-
38
-
39
-
40
-
41
-
42
-
43
-
44
-
45
-
46
-
47
-
48
-
49
-
50
-
51
-
52
-
53
-
54
-
55
-
56
-
57
-
58
-
59
-
60
-
61
-
62
-
63
-
64
-
65
-
66
-
67
-
68
-
69
-
70
-
71
-
72
-
73
-
74
-
75
-
76
-
77
-
78
-
79
-
80
-
81
-
82
-
83
-
84
-
85
-
86
-
87
-
88
-
89
-
90
-
91
-
92
-
93
-
94
-
95
-
96
-
97
-
98
-
99
-
100
-
101
-
102
-
103
-
104
-
105
-
106
-
107
-
108
-
109
-
110
-
111
-
112
-
113
-
114
-
115
-
116
-
117
-
118
-
119
-
120
-
121
-
122
-
123
-
124
-
125
-
126
-
127
-
128
-
129
-
130
-
131
-
132
-
133
-
134
-
135
-
136
-
137
-
138
-
139
-
140
-
141
-
142
-
143
-
144
-
145
-
146
-
147
-
148
-
149
-
150
-
151
-
152
-
153
-
154
-
155
-
156
-
157
-
158
-
159
-
160
-
161
-
162
-
163
-
164
-
165
-
166
-
167
-
168
-
169
-
170
-
171
-
172
-
173
-
174
-
175
-
176
-
177
-
178
-
179
-
180
-
181
-
182
-
183
-
184
-
185
-
186
-
187
-
188
-
189
-
190
-
191
-
192
-
193
-
194
-
195
-
196
-
197
-
198
-
199
-
200
-
201
-
202
-
203
-
204
-
205
-
206
-
207
-
208
-
209
-
210
-
211
-
212
-
213
-
214
-
215
-
216
-
217
-
218
-
219
-
220
-
221
-
222
-
223
-
224
-
225
-
226
-
227
-
228
-
229
-
230
-
231
-
232
-
233
-
234
-
235
-
236
-
237
-
238
-
239
-
240
-
241
-
242
-
 243
243 -
 244
244 -
 245
245 -
 246
246 -
 247
247 -
 248
248 -
 249
249 -
 250
250 -
 251
251 -
 252
252 -
 253
253 -
 254
254 -
 255
255 -
 256
256 -
 257
257 -
 258
258 -
 259
259 -
 260
260 -
 261
261 -
 262
262 -
 263
263 -
264
-
265
-
266
-
267
-
268
-
269
-
270
-
271
-
272
-
273
-
274
-
275
-
276
-
277
-
278
-
279
-
280
 |
 |

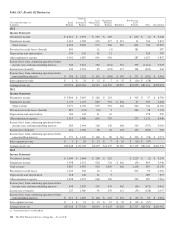
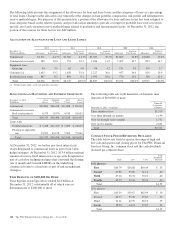
Table 162: Results Of Businesses
Year ended December 31
In millions
Retail
Banking
Corporate
&
Institutional
Banking
Asset
Management
Group
Residential
Mortgage
Banking BlackRock
Non-Strategic
Assets
Portfolio Other Consolidated
2012
Income Statement
Net interest income $ 4,314 $ 3,991 $ 297 $ 209 $ 830 $ (1) $ 9,640
Noninterest income 2,012 1,598 676 317 $ 512 13 744 5,872
Total revenue 6,326 5,589 973 526 512 843 743 15,512
Provision for credit losses (benefit) 800 11 (5) 181 987
Depreciation and amortization 194 141 41 11 320 707
Other noninterest expense 4,392 1,887 691 981 287 1,637 9,875
Income (loss) from continuing operations before
income taxes and noncontrolling interests 940 3,561 230 (461) 512 375 (1,214) 3,943
Income taxes (benefit) 344 1,233 85 (153) 117 138 (822) 942
Income (loss) from continuing operations before
noncontrolling interests $ 596 $ 2,328 $ 145 $ (308) $ 395 $ 237 $ (392) $ 3,001
Inter-segment revenue $ 1 $ 33 $ 12 $ 7 $ 15 $ (10) $ (58)
Average Assets (a) $72,573 $102,962 $6,735 $11,529 $5,857 $12,050 $83,319 $295,025
2011
Income Statement
Net interest income $ 3,804 $ 3,465 $ 280 $ 201 $ 913 $ 37 $ 8,700
Noninterest income 1,773 1,237 649 751 $ 464 47 705 5,626
Total revenue 5,577 4,702 929 952 464 960 742 14,326
Provision for credit losses (benefit) 891 (124) (24) 5 366 38 1,152
Depreciation and amortization 186 144 41 10 278 659
Other noninterest expense 3,917 1,688 646 787 275 1,133 8,446
Income (loss) from continuing operations before
income taxes and noncontrolling interests 583 2,994 266 150 464 319 (707) 4,069
Income taxes (benefit) 212 1,054 98 61 103 119 (649) 998
Income (loss) from continuing operations before
noncontrolling interests $ 371 $ 1,940 $ 168 $ 89 $ 361 $ 200 $ (58) $ 3,071
Inter-segment revenue $ 1 $ 20 $ 13 $ 7 $ 16 $ (10) $ (47)
Average Assets (a) $66,448 $ 81,043 $6,719 $11,270 $5,516 $13,119 $81,220 $265,335
2010
Income Statement
Net interest income $ 3,849 $ 3,604 $ 288 $ 262 $ 1,229 $ (2) $ 9,230
Noninterest income 1,958 1,351 628 741 $ 462 (93) 899 5,946
Total revenue 5,807 4,955 916 1,003 462 1,136 897 15,176
Provision for credit losses 1,103 303 20 5 976 95 2,502
Depreciation and amortization 218 148 41 3 287 697
Other noninterest expense 3,838 1,675 606 560 250 987 7,916
Income (loss) from continuing operations before
income taxes and noncontrolling interests 648 2,829 249 435 462 (90) (472) 4,061
Income taxes (benefit) 237 1,000 91 159 111 (33) (528) 1,037
Income (loss) from continuing operations before
noncontrolling interests $ 411 $ 1,829 $ 158 $ 276 $ 351 $ (57) $ 56 $ 3,024
Inter-segment revenue $ 1 $ 21 $ 13 $ 12 $ 22 $ (12) $ (57)
Average Assets (a) $67,428 $ 77,540 $6,954 $ 9,247 $5,428 $17,517 $80,788 $264,902
(a) Period-end balances for BlackRock.
234 The PNC Financial Services Group, Inc. – Form 10-K