PNC Bank 2012 Annual Report Download - page 183
Download and view the complete annual report
Please find page 183 of the 2012 PNC Bank annual report below. You can navigate through the pages in the report by either clicking on the pages listed below, or by using the keyword search tool below to find specific information within the annual report.-
 1
1 -
2
-
3
-
4
-
5
-
6
-
7
-
8
-
9
-
10
-
11
-
12
-
13
-
14
-
15
-
16
-
17
-
18
-
19
-
20
-
21
-
22
-
23
-
24
-
25
-
26
-
27
-
28
-
29
-
30
-
31
-
32
-
33
-
34
-
35
-
36
-
37
-
38
-
39
-
40
-
41
-
42
-
43
-
44
-
45
-
46
-
47
-
48
-
49
-
50
-
51
-
52
-
53
-
54
-
55
-
56
-
57
-
58
-
59
-
60
-
61
-
62
-
63
-
64
-
65
-
66
-
67
-
68
-
69
-
70
-
71
-
72
-
73
-
74
-
75
-
76
-
77
-
78
-
79
-
80
-
81
-
82
-
83
-
84
-
85
-
86
-
87
-
88
-
89
-
90
-
91
-
92
-
93
-
94
-
95
-
96
-
97
-
98
-
99
-
100
-
101
-
102
-
103
-
104
-
105
-
106
-
107
-
108
-
109
-
110
-
111
-
112
-
113
-
114
-
115
-
116
-
117
-
118
-
119
-
120
-
121
-
122
-
123
-
124
-
125
-
126
-
127
-
128
-
129
-
130
-
131
-
132
-
133
-
134
-
135
-
136
-
137
-
138
-
139
-
140
-
141
-
142
-
143
-
144
-
145
-
146
-
147
-
148
-
149
-
150
-
151
-
152
-
153
-
154
-
155
-
156
-
157
-
158
-
159
-
160
-
161
-
162
-
163
-
164
-
165
-
166
-
167
-
168
-
169
-
170
-
171
-
172
-
 173
173 -
 174
174 -
 175
175 -
 176
176 -
 177
177 -
 178
178 -
 179
179 -
 180
180 -
 181
181 -
 182
182 -
 183
183 -
 184
184 -
 185
185 -
 186
186 -
 187
187 -
 188
188 -
 189
189 -
 190
190 -
 191
191 -
 192
192 -
 193
193 -
194
-
195
-
196
-
197
-
198
-
199
-
200
-
201
-
202
-
203
-
204
-
205
-
206
-
207
-
208
-
209
-
210
-
211
-
212
-
213
-
214
-
215
-
216
-
217
-
218
-
219
-
220
-
221
-
222
-
223
-
224
-
225
-
226
-
227
-
228
-
229
-
230
-
231
-
232
-
233
-
234
-
235
-
236
-
237
-
238
-
239
-
240
-
241
-
242
-
243
-
244
-
245
-
246
-
247
-
248
-
249
-
250
-
251
-
252
-
253
-
254
-
255
-
256
-
257
-
258
-
259
-
260
-
261
-
262
-
263
-
264
-
265
-
266
-
267
-
268
-
269
-
270
-
271
-
272
-
273
-
274
-
275
-
276
-
277
-
278
-
279
-
280
 |
 |

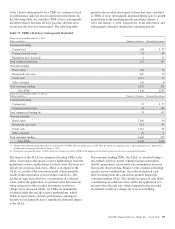
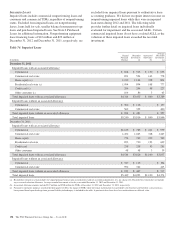
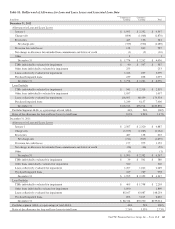
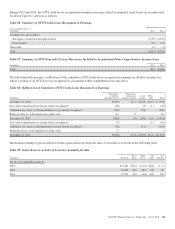
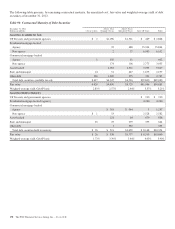
Table 81: Rollforward of Allowance for Loan and Lease Losses and Associated Loan Data
(continued from previous page)
In millions
Commercial
Lending
Consumer
Lending Total
December 31, 2010
Allowance for Loan and Lease Losses
January 1 $ 3,345 $ 1,727 $ 5,072
Charge-offs (2,017) (1,475) (3,492)
Recoveries 427 129 556
Net charge-offs (1,590) (1,346) (2,936)
Provision for credit losses 704 1,798 2,502
Adoption of ASU 2009-17, Consolidations 141 141
Net change in allowance for unfunded loan commitments and letters of credit 108 108
December 31 $ 2,567 $ 2,320 $ 4,887
TDRs individually evaluated for impairment $ 24 $ 485 $ 509
Other loans individually evaluated for impairment 835 835
Loans collectively evaluated for impairment 1,419 1,227 2,646
Purchased impaired loans 289 608 897
December 31 $ 2,567 $ 2,320 $ 4,887
Loan Portfolio
TDRs individually evaluated for impairment $ 200 $ 1,422 $ 1,622
Other loans individually evaluated for impairment 2,888 2,888
Loans collectively evaluated for impairment 75,014 63,291 138,305
Purchased impaired loans 1,402 6,378 7,780
December 31 $79,504 $71,091 $150,595
Portfolio segment ALLL as a percentage of total ALLL 53% 47% 100%
Ratio of the allowance for loan and lease losses to total loans 3.23% 3.26% 3.25%
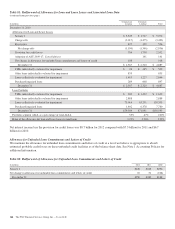
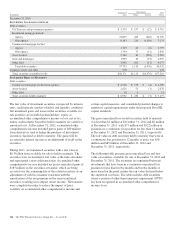
Net interest income less the provision for credit losses was $8.7 billion for 2012 compared with $7.5 billion for 2011 and $6.7
billion for 2010.
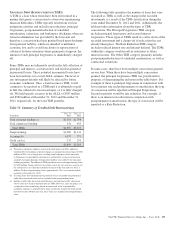
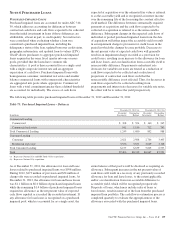
Allowance for Unfunded Loan Commitments and Letters of Credit
We maintain the allowance for unfunded loan commitments and letters of credit at a level we believe is appropriate to absorb
estimated probable credit losses on these unfunded credit facilities as of the balance sheet date. See Note 1 Accounting Policies for
additional information.
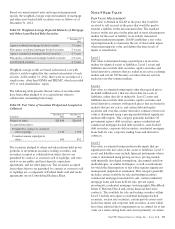
Table 82: Rollforward of Allowance for Unfunded Loan Commitments and Letters of Credit
In millions 2012 2011 2010
January 1 $240 $188 $296
Net change in allowance for unfunded loan commitments and letters of credit 10 52 (108)
December 31 $250 $240 $188
164 The PNC Financial Services Group, Inc. – Form 10-K