PNC Bank 2012 Annual Report Download - page 115
Download and view the complete annual report
Please find page 115 of the 2012 PNC Bank annual report below. You can navigate through the pages in the report by either clicking on the pages listed below, or by using the keyword search tool below to find specific information within the annual report.-
 1
1 -
2
-
3
-
4
-
5
-
6
-
7
-
8
-
9
-
10
-
11
-
12
-
13
-
14
-
15
-
16
-
17
-
18
-
19
-
20
-
21
-
22
-
23
-
24
-
25
-
26
-
27
-
28
-
29
-
30
-
31
-
32
-
33
-
34
-
35
-
36
-
37
-
38
-
39
-
40
-
41
-
42
-
43
-
44
-
45
-
46
-
47
-
48
-
49
-
50
-
51
-
52
-
53
-
54
-
55
-
56
-
57
-
58
-
59
-
60
-
61
-
62
-
63
-
64
-
65
-
66
-
67
-
68
-
69
-
70
-
71
-
72
-
73
-
74
-
75
-
76
-
77
-
78
-
79
-
80
-
81
-
82
-
83
-
84
-
85
-
86
-
87
-
88
-
89
-
90
-
91
-
92
-
93
-
94
-
95
-
96
-
97
-
98
-
99
-
100
-
101
-
102
-
103
-
104
-
 105
105 -
 106
106 -
 107
107 -
 108
108 -
 109
109 -
 110
110 -
 111
111 -
 112
112 -
 113
113 -
 114
114 -
 115
115 -
 116
116 -
 117
117 -
 118
118 -
 119
119 -
 120
120 -
 121
121 -
 122
122 -
 123
123 -
 124
124 -
 125
125 -
126
-
127
-
128
-
129
-
130
-
131
-
132
-
133
-
134
-
135
-
136
-
137
-
138
-
139
-
140
-
141
-
142
-
143
-
144
-
145
-
146
-
147
-
148
-
149
-
150
-
151
-
152
-
153
-
154
-
155
-
156
-
157
-
158
-
159
-
160
-
161
-
162
-
163
-
164
-
165
-
166
-
167
-
168
-
169
-
170
-
171
-
172
-
173
-
174
-
175
-
176
-
177
-
178
-
179
-
180
-
181
-
182
-
183
-
184
-
185
-
186
-
187
-
188
-
189
-
190
-
191
-
192
-
193
-
194
-
195
-
196
-
197
-
198
-
199
-
200
-
201
-
202
-
203
-
204
-
205
-
206
-
207
-
208
-
209
-
210
-
211
-
212
-
213
-
214
-
215
-
216
-
217
-
218
-
219
-
220
-
221
-
222
-
223
-
224
-
225
-
226
-
227
-
228
-
229
-
230
-
231
-
232
-
233
-
234
-
235
-
236
-
237
-
238
-
239
-
240
-
241
-
242
-
243
-
244
-
245
-
246
-
247
-
248
-
249
-
250
-
251
-
252
-
253
-
254
-
255
-
256
-
257
-
258
-
259
-
260
-
261
-
262
-
263
-
264
-
265
-
266
-
267
-
268
-
269
-
270
-
271
-
272
-
273
-
274
-
275
-
276
-
277
-
278
-
279
-
280
 |
 |
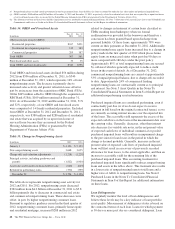
Our commercial pool reserve methodology is sensitive to
changes in key risk parameters such as PD and LGD; the
results of these parameters are then applied to the loan balance
to determine the amount of the reserve. In general, a given
change in any of the major risk parameters will have a
corresponding change in the pool reserve allocations for non-
impaired commercial loans. To illustrate, if we increase the
pool reserve LGD by 5% for all categories of non-impaired
commercial loans at December 31, 2012, then the aggregate of
the ALLL and allowance for unfunded loan commitments and
letters of credit would increase by $74 million.
The majority of the commercial portfolio is secured by
collateral, including loans to asset-based lending customers
that continue to show demonstrably lower LGD. Further, the
large investment grade or equivalent portion of the loan
portfolio has performed well and has not been subject to
significant deterioration. Additionally, guarantees on loans
greater than $1 million and owner guarantees for small
business loans do not significantly impact our ALLL.
Allocations to non-impaired consumer loan classes are based
upon a roll-rate model which uses statistical relationships,
calculated from historical data that estimate the movement of
loan outstandings through the various stages of delinquency
and ultimately charge-off.
A portion of the ALLL related to qualitative and measurement
factors has been assigned to loan categories. These factors
include, but are not limited to, the following:
• Industry concentrations and conditions,
• Recent credit quality trends,
• Recent loss experience in particular portfolios,
• Recent macro-economic factors,
• Changes in risk selection and underwriting standards,
and
• Timing of available information, including the
performance of first lien positions.
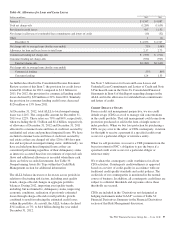
Purchased impaired loans are initially recorded at fair value
and applicable accounting guidance prohibits the carry over or
creation of valuation allowances at acquisition. Because the
initial fair values of these loans already reflect a credit
component, additional reserves are established when
performance is expected to be worse than our expectations as
of the acquisition date. At December 31, 2012, we had
established reserves of $1.1 billion for purchased impaired
loans. In addition, all loans (purchased impaired and non-
impaired) acquired in the RBC Bank (USA) acquisition were
recorded at fair value.No allowance for loan losses was
carried over and no allowance was created at acquisition. See
Note 6 Purchased Loans in the Notes To Consolidated
Financial Statements in Item 8 of this Report for additional
information.
In addition to the ALLL, we maintain an allowance for
unfunded loan commitments and letters of credit. We report
this allowance as a liability on our Consolidated Balance
Sheet. We maintain the allowance for unfunded loan
commitments and letters of credit at a level we believe is
appropriate to absorb estimated probable losses on these
unfunded credit facilities. We determine this amount using
estimates of the probability of the ultimate funding and losses
related to those credit exposures. Other than the estimation of
the probability of funding, this methodology is similar to the
one we use for determining our ALLL.
We refer you to Note 5 Asset Quality and Note 7 Allowances
for Loan and Lease Losses and Unfunded Loan Commitments
and Letters of Credit in the Notes To Consolidated Financial
Statements in Item 8 of this Report for further information on
key asset quality indicators that we use to evaluate our
portfolio and establish the allowances.
96 The PNC Financial Services Group, Inc. – Form 10-K