PNC Bank 2012 Annual Report Download - page 142
Download and view the complete annual report
Please find page 142 of the 2012 PNC Bank annual report below. You can navigate through the pages in the report by either clicking on the pages listed below, or by using the keyword search tool below to find specific information within the annual report.-
 1
1 -
2
-
3
-
4
-
5
-
6
-
7
-
8
-
9
-
10
-
11
-
12
-
13
-
14
-
15
-
16
-
17
-
18
-
19
-
20
-
21
-
22
-
23
-
24
-
25
-
26
-
27
-
28
-
29
-
30
-
31
-
32
-
33
-
34
-
35
-
36
-
37
-
38
-
39
-
40
-
41
-
42
-
43
-
44
-
45
-
46
-
47
-
48
-
49
-
50
-
51
-
52
-
53
-
54
-
55
-
56
-
57
-
58
-
59
-
60
-
61
-
62
-
63
-
64
-
65
-
66
-
67
-
68
-
69
-
70
-
71
-
72
-
73
-
74
-
75
-
76
-
77
-
78
-
79
-
80
-
81
-
82
-
83
-
84
-
85
-
86
-
87
-
88
-
89
-
90
-
91
-
92
-
93
-
94
-
95
-
96
-
97
-
98
-
99
-
100
-
101
-
102
-
103
-
104
-
105
-
106
-
107
-
108
-
109
-
110
-
111
-
112
-
113
-
114
-
115
-
116
-
117
-
118
-
119
-
120
-
121
-
122
-
123
-
124
-
125
-
126
-
127
-
128
-
129
-
130
-
131
-
 132
132 -
 133
133 -
 134
134 -
 135
135 -
 136
136 -
 137
137 -
 138
138 -
 139
139 -
 140
140 -
 141
141 -
 142
142 -
 143
143 -
 144
144 -
 145
145 -
 146
146 -
 147
147 -
 148
148 -
 149
149 -
 150
150 -
 151
151 -
 152
152 -
153
-
154
-
155
-
156
-
157
-
158
-
159
-
160
-
161
-
162
-
163
-
164
-
165
-
166
-
167
-
168
-
169
-
170
-
171
-
172
-
173
-
174
-
175
-
176
-
177
-
178
-
179
-
180
-
181
-
182
-
183
-
184
-
185
-
186
-
187
-
188
-
189
-
190
-
191
-
192
-
193
-
194
-
195
-
196
-
197
-
198
-
199
-
200
-
201
-
202
-
203
-
204
-
205
-
206
-
207
-
208
-
209
-
210
-
211
-
212
-
213
-
214
-
215
-
216
-
217
-
218
-
219
-
220
-
221
-
222
-
223
-
224
-
225
-
226
-
227
-
228
-
229
-
230
-
231
-
232
-
233
-
234
-
235
-
236
-
237
-
238
-
239
-
240
-
241
-
242
-
243
-
244
-
245
-
246
-
247
-
248
-
249
-
250
-
251
-
252
-
253
-
254
-
255
-
256
-
257
-
258
-
259
-
260
-
261
-
262
-
263
-
264
-
265
-
266
-
267
-
268
-
269
-
270
-
271
-
272
-
273
-
274
-
275
-
276
-
277
-
278
-
279
-
280
 |
 |

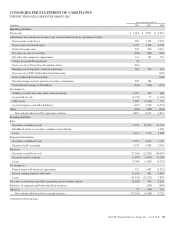
CONSOLIDATED STATEMENT OF CASH FLOWS
THE PNC FINANCIAL SERVICES GROUP, INC.
Year ended December 31
In millions 2012 2011 2010
Operating Activities
Net income $ 3,001 $ 3,071 $ 3,397
Adjustments to reconcile net income to net cash provided (used) by operating activities
Provision for credit losses 987 1,152 2,502
Depreciation and amortization 1,159 1,140 1,059
Deferred income taxes 570 840 1,019
Net gains on sales of securities (204) (249) (426)
Net other-than-temporary impairments 111 152 325
Charge for goodwill impairment 45
Gains on sales of Visa Class B common shares (267)
Mortgage servicing rights valuation adjustment 284 726 434
Gain on sale of PNC Global Investment Servicing (639)
Gains on BlackRock transactions (160)
Noncash charges on trust preferred securities redemptions 295 198
Undistributed earnings of BlackRock (302) (262) (291)
Net change in
Trading securities and other short-term investments 1,350 330 468
Loans held for sale (1,125) 77 (1,154)
Other assets 1,928 (4,142) 753
Accrued expenses and other liabilities (697) 3,330 (1,571)
Other (308) (328) (904)
Net cash provided (used) by operating activities 6,827 6,035 4,812
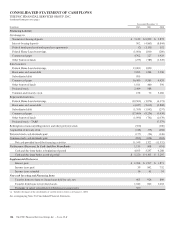
Investing Activities
Sales
Securities available for sale 9,358 20,533 23,343
BlackRock stock via secondary common stock offering 1,198
Loans 1,611 1,770 1,868
Repayments/maturities
Securities available for sale 9,195 6,074 7,730
Securities held to maturity 3,174 2,859 2,433
Purchases
Securities available for sale (17,164) (25,551) (36,653)
Securities held to maturity (1,479) (1,607) (1,296)
Loans (1,796) (2,401) (4,275)
Net change in
Federal funds sold and resale agreements 732 1,487 (1,313)
Interest-earning deposits with banks (2,526) 441 2,684
Loans (14,333) (10,224) 7,855
Net cash received from (paid for) acquisition and divestiture activity (4,130) 430 2,202
Purchases of corporate and bank owned life insurance – (200) (800)
Other (a) 97 (160) 753
Net cash provided (used) by investing activities (17,261) (6,549) 5,729
(continued on following page)
The PNC Financial Services Group, Inc. – Form 10-K 123