PNC Bank 2012 Annual Report Download - page 166
Download and view the complete annual report
Please find page 166 of the 2012 PNC Bank annual report below. You can navigate through the pages in the report by either clicking on the pages listed below, or by using the keyword search tool below to find specific information within the annual report.-
 1
1 -
2
-
3
-
4
-
5
-
6
-
7
-
8
-
9
-
10
-
11
-
12
-
13
-
14
-
15
-
16
-
17
-
18
-
19
-
20
-
21
-
22
-
23
-
24
-
25
-
26
-
27
-
28
-
29
-
30
-
31
-
32
-
33
-
34
-
35
-
36
-
37
-
38
-
39
-
40
-
41
-
42
-
43
-
44
-
45
-
46
-
47
-
48
-
49
-
50
-
51
-
52
-
53
-
54
-
55
-
56
-
57
-
58
-
59
-
60
-
61
-
62
-
63
-
64
-
65
-
66
-
67
-
68
-
69
-
70
-
71
-
72
-
73
-
74
-
75
-
76
-
77
-
78
-
79
-
80
-
81
-
82
-
83
-
84
-
85
-
86
-
87
-
88
-
89
-
90
-
91
-
92
-
93
-
94
-
95
-
96
-
97
-
98
-
99
-
100
-
101
-
102
-
103
-
104
-
105
-
106
-
107
-
108
-
109
-
110
-
111
-
112
-
113
-
114
-
115
-
116
-
117
-
118
-
119
-
120
-
121
-
122
-
123
-
124
-
125
-
126
-
127
-
128
-
129
-
130
-
131
-
132
-
133
-
134
-
135
-
136
-
137
-
138
-
139
-
140
-
141
-
142
-
143
-
144
-
145
-
146
-
147
-
148
-
149
-
150
-
151
-
152
-
153
-
154
-
155
-
 156
156 -
 157
157 -
 158
158 -
 159
159 -
 160
160 -
 161
161 -
 162
162 -
 163
163 -
 164
164 -
 165
165 -
 166
166 -
 167
167 -
 168
168 -
 169
169 -
 170
170 -
 171
171 -
 172
172 -
 173
173 -
 174
174 -
 175
175 -
 176
176 -
177
-
178
-
179
-
180
-
181
-
182
-
183
-
184
-
185
-
186
-
187
-
188
-
189
-
190
-
191
-
192
-
193
-
194
-
195
-
196
-
197
-
198
-
199
-
200
-
201
-
202
-
203
-
204
-
205
-
206
-
207
-
208
-
209
-
210
-
211
-
212
-
213
-
214
-
215
-
216
-
217
-
218
-
219
-
220
-
221
-
222
-
223
-
224
-
225
-
226
-
227
-
228
-
229
-
230
-
231
-
232
-
233
-
234
-
235
-
236
-
237
-
238
-
239
-
240
-
241
-
242
-
243
-
244
-
245
-
246
-
247
-
248
-
249
-
250
-
251
-
252
-
253
-
254
-
255
-
256
-
257
-
258
-
259
-
260
-
261
-
262
-
263
-
264
-
265
-
266
-
267
-
268
-
269
-
270
-
271
-
272
-
273
-
274
-
275
-
276
-
277
-
278
-
279
-
280
 |
 |

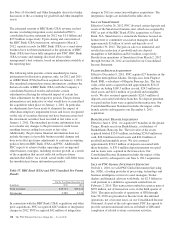
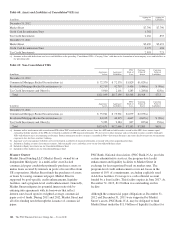
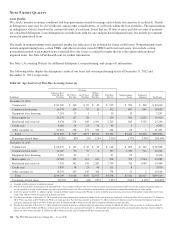
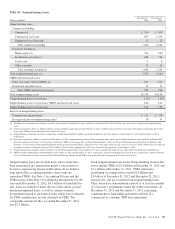
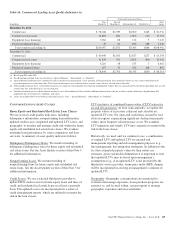
Table 65: Nonperforming Assets
Dollars in millions
December 31
2012
December 31
2011
Nonperforming loans
Commercial lending
Commercial $ 590 $ 899
Commercial real estate 807 1,345
Equipment lease financing 13 22
Total commercial lending 1,410 2,266
Consumer lending (a)
Home equity (b) 951 529
Residential real estate (c) 845 726
Credit card 58
Other consumer 43 31
Total consumer lending (d) 1,844 1,294
Total nonperforming loans (e) 3,254 3,560
OREO and foreclosed assets
Other real estate owned (OREO) (f) 507 561
Foreclosed and other assets 33 35
Total OREO and foreclosed assets 540 596
Total nonperforming assets $3,794 $4,156
Nonperforming loans to total loans 1.75% 2.24%
Nonperforming assets to total loans, OREO and foreclosed assets 2.04 2.60
Nonperforming assets to total assets 1.24 1.53
Interest on nonperforming loans
Computed on original terms $ 212 $ 278
Recognized prior to nonperforming status 30 47
(a) Excludes most consumer loans and lines of credit, not secured by residential real estate, which are charged off after 120 to 180 days past due and are not placed on nonperforming
status.
(b) In the first quarter of 2012, we adopted a policy stating that Home equity loans past due 90 days or more would be placed on nonaccrual status. Prior policy required that these loans
be past due 180 days before being placed on nonaccrual status.
(c) Nonperforming residential real estate excludes loans of $69 million and $61 million accounted for under the fair value option as of December 31, 2012 and December 31, 2011,
respectively.
(d) Pursuant to regulatory guidance issued in the third quarter of 2012, nonperforming consumer loans, primarily home equity and residential mortgage, increased $288 million in 2012
related to changes in treatment of certain loans classified as TDRs, net of charge-offs, resulting from bankruptcy where no formal reaffirmation was provided by the borrower and
therefore a concession has been granted based upon discharge from personal liability. Charge-offs have been taken where the fair value less costs to sell the collateral was less than the
recorded investment of the loan and were $128.1 million. Of these loans, approximately 78% were current on their payments at December 31, 2012.
(e) Nonperforming loans exclude certain government insured or guaranteed loans, loans held for sale, loans accounted for under the fair value option and purchased impaired loans.
(f) OREO excludes $380 million and $280 million at December 31, 2012 and December 31, 2011, respectively, related to residential real estate that was acquired by us upon foreclosure
of serviced loans because they are insured by the Federal Housing Administration (FHA) or guaranteed by the Department of Veterans Affairs (VA).
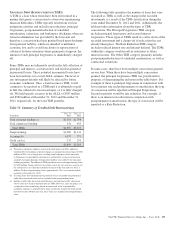
Nonperforming loans also include loans whose terms have
been restructured in a manner that grants a concession to a
borrower experiencing financial difficulties. In accordance
with applicable accounting guidance, these loans are
considered TDRs. See Note 1 Accounting Policies and the
TDR section of this Note 5 for additional information. For the
year ended December 31, 2012, $3.1 billion of loans held for
sale, loans accounted for under the fair value option, pooled
purchased impaired loans, as well as certain consumer
government insured or guaranteed loans which were evaluated
for TDR consideration, are not classified as TDRs. The
comparable amount for the year ended December 31, 2011
was $2.7 billion.
Total nonperforming loans in the Nonperforming Assets table
above include TDRs of $1.6 billion at December 31, 2012 and
$1.1 billion at December 31, 2011. TDRs returned to
performing (accruing) status totaled $1.0 billion and
$.8 billion at December 31, 2012 and December 31, 2011,
respectively, and are excluded from nonperforming loans.
These loans have demonstrated a period of at least six months
of consecutive performance under the restructured terms. At
December 31, 2012 and December 31, 2011, remaining
commitments to lend additional funds to debtors in a
commercial or consumer TDR were immaterial.
The PNC Financial Services Group, Inc. – Form 10-K 147