PNC Bank 2012 Annual Report Download - page 222
Download and view the complete annual report
Please find page 222 of the 2012 PNC Bank annual report below. You can navigate through the pages in the report by either clicking on the pages listed below, or by using the keyword search tool below to find specific information within the annual report.-
 1
1 -
2
-
3
-
4
-
5
-
6
-
7
-
8
-
9
-
10
-
11
-
12
-
13
-
14
-
15
-
16
-
17
-
18
-
19
-
20
-
21
-
22
-
23
-
24
-
25
-
26
-
27
-
28
-
29
-
30
-
31
-
32
-
33
-
34
-
35
-
36
-
37
-
38
-
39
-
40
-
41
-
42
-
43
-
44
-
45
-
46
-
47
-
48
-
49
-
50
-
51
-
52
-
53
-
54
-
55
-
56
-
57
-
58
-
59
-
60
-
61
-
62
-
63
-
64
-
65
-
66
-
67
-
68
-
69
-
70
-
71
-
72
-
73
-
74
-
75
-
76
-
77
-
78
-
79
-
80
-
81
-
82
-
83
-
84
-
85
-
86
-
87
-
88
-
89
-
90
-
91
-
92
-
93
-
94
-
95
-
96
-
97
-
98
-
99
-
100
-
101
-
102
-
103
-
104
-
105
-
106
-
107
-
108
-
109
-
110
-
111
-
112
-
113
-
114
-
115
-
116
-
117
-
118
-
119
-
120
-
121
-
122
-
123
-
124
-
125
-
126
-
127
-
128
-
129
-
130
-
131
-
132
-
133
-
134
-
135
-
136
-
137
-
138
-
139
-
140
-
141
-
142
-
143
-
144
-
145
-
146
-
147
-
148
-
149
-
150
-
151
-
152
-
153
-
154
-
155
-
156
-
157
-
158
-
159
-
160
-
161
-
162
-
163
-
164
-
165
-
166
-
167
-
168
-
169
-
170
-
171
-
172
-
173
-
174
-
175
-
176
-
177
-
178
-
179
-
180
-
181
-
182
-
183
-
184
-
185
-
186
-
187
-
188
-
189
-
190
-
191
-
192
-
193
-
194
-
195
-
196
-
197
-
198
-
199
-
200
-
201
-
202
-
203
-
204
-
205
-
206
-
207
-
208
-
209
-
210
-
211
-
 212
212 -
 213
213 -
 214
214 -
 215
215 -
 216
216 -
 217
217 -
 218
218 -
 219
219 -
 220
220 -
 221
221 -
 222
222 -
 223
223 -
 224
224 -
 225
225 -
 226
226 -
 227
227 -
 228
228 -
 229
229 -
 230
230 -
 231
231 -
 232
232 -
233
-
234
-
235
-
236
-
237
-
238
-
239
-
240
-
241
-
242
-
243
-
244
-
245
-
246
-
247
-
248
-
249
-
250
-
251
-
252
-
253
-
254
-
255
-
256
-
257
-
258
-
259
-
260
-
261
-
262
-
263
-
264
-
265
-
266
-
267
-
268
-
269
-
270
-
271
-
272
-
273
-
274
-
275
-
276
-
277
-
278
-
279
-
280
 |
 |

To determine stock-based compensation expense, the grant-
date fair value is applied to the options granted with a
reduction for estimated forfeitures. We recognize
compensation expense for stock options on a straight-line
basis over the pro rata vesting period.
At December 31, 2011 and 2010, options for 12,337,000 and
13,397,000 shares of common stock were exercisable at a
weighted-average price of $106.08 and $118.21, respectively.
The total intrinsic value of options exercised during 2012,
2011 and 2010 was $37 million, $4 million and $5 million.
Cash received from option exercises under all Incentive Plans
for 2012, 2011 and 2010 was approximately $118 million, $41
million and $15 million, respectively. The actual tax benefit
realized for tax deduction purposes from option exercises
under all Incentive Plans for 2012, 2011 and 2010 was
approximately $41 million, $14 million and $5 million,
respectively.
There were no options granted in excess of market value in
2012, 2011 or 2010. Shares of common stock available during
the next year for the granting of options and other awards
under the Incentive Plans were 29,192,854 at December 31,
2012. Total shares of PNC common stock authorized for
future issuance under equity compensation plans totaled
30,537,674 shares at December 31, 2012, which includes
shares available for issuance under the Incentive Plans and the
Employee Stock Purchase Plan (ESPP) as described below.
During 2012, we issued approximately 1.7 million shares from
treasury stock in connection with stock option exercise
activity. As with past exercise activity, we currently intend to
utilize primarily treasury stock for any future stock option
exercises. Awards granted to non-employee directors in 2012,
2011 and 2010 include 25,620, 27,090 and 29,040 deferred
stock units, respectively, awarded under the Outside Directors
Deferred Stock Unit Plan. A deferred stock unit is a phantom
share of our common stock, which requires liability
accounting treatment until such awards are paid to the
participants as cash. As there are no vesting or service
requirements on these awards, total compensation expense is
recognized in full on awarded deferred stock units on the date
of grant.
I
NCENTIVE
/P
ERFORMANCE
U
NIT
S
HARE
A
WARDS AND
R
ESTRICTED
S
TOCK
/U
NIT
A
WARDS
The fair value of nonvested incentive/performance unit share
awards and restricted stock/unit awards is initially determined
based on prices not less than the market value of our common
stock price on the date of grant. The value of certain incentive/
performance unit share awards is subsequently remeasured
based on the achievement of one or more financial and other
performance goals generally over a three-year period. The
Personnel and Compensation Committee of the Board of
Directors approves the final award payout with respect to
incentive/performance unit share awards. Restricted stock/unit
awards have various vesting periods generally ranging from
36 months to 60 months.
Beginning in 2012, we incorporated several risk-related
performance changes to certain incentive compensation
programs. In addition to achieving certain financial
performance metrics relative to our peers, the final payout
amount will be subject to a negative adjustment if PNC fails to
meet certain risk-related performance metrics as specified in
the award agreement. However, the P&CC has the discretion
to reduce any or all of this negative adjustment under certain
circumstances. These awards have a three-year performance
period and are payable in either stock or a combination of
stock and cash. Additionally, performance-based restricted
share units were granted in 2012 to certain of our executives
in lieu of stock options, with generally the same terms and
conditions as the 2011 awards of the same.
The weighted-average grant-date fair value of incentive/
performance unit share awards and restricted stock/unit
awards granted in 2012, 2011 and 2010 was $60.68, $63.25
and $54.59 per share, respectively. We recognize
compensation expense for such awards ratably over the
corresponding vesting and/or performance periods for each
type of program.
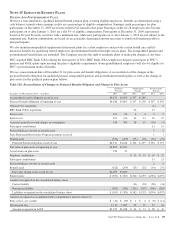
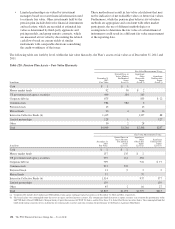
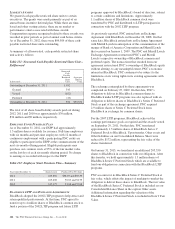
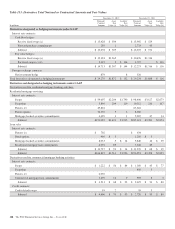
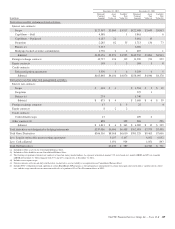
Table 130: Nonvested Incentive/Performance Unit Share
Awards and Restricted Stock/Unit Awards – Rollforward
Shares in thousands
Nonvested
Incentive/
Performance
Unit Shares
Weighted-
Average
Grant
Date Fair
Value
Nonvested
Restricted
Stock/
Unit
Shares
Weighted-
Average
Grant
Date Fair
Value
December 31, 2011 830 $61.68 2,512 $54.87
Granted 465 60.70 1,534 60.67
Vested (100) 64.21 (831) 45.47
Forfeited (76) 60.27 (154) 60.51
December 31, 2012 1,119 $61.14 3,061 $60.04
In the chart above, the unit shares and related weighted-
average grant-date fair value of the incentive/performance
awards exclude the effect of dividends on the underlying
shares, as those dividends will be paid in cash.
At December 31, 2012, there was $86 million of unrecognized
deferred compensation expense related to nonvested share-
based compensation arrangements granted under the Incentive
Plans. This cost is expected to be recognized as expense over a
period of no longer than five years. The total fair value of
incentive/performance unit share and restricted stock/unit
awards vested during 2012, 2011 and 2010 was approximately
$55 million, $52 million and $39 million, respectively.
The PNC Financial Services Group, Inc. – Form 10-K 203