PNC Bank 2012 Annual Report Download - page 196
Download and view the complete annual report
Please find page 196 of the 2012 PNC Bank annual report below. You can navigate through the pages in the report by either clicking on the pages listed below, or by using the keyword search tool below to find specific information within the annual report.-
 1
1 -
2
-
3
-
4
-
5
-
6
-
7
-
8
-
9
-
10
-
11
-
12
-
13
-
14
-
15
-
16
-
17
-
18
-
19
-
20
-
21
-
22
-
23
-
24
-
25
-
26
-
27
-
28
-
29
-
30
-
31
-
32
-
33
-
34
-
35
-
36
-
37
-
38
-
39
-
40
-
41
-
42
-
43
-
44
-
45
-
46
-
47
-
48
-
49
-
50
-
51
-
52
-
53
-
54
-
55
-
56
-
57
-
58
-
59
-
60
-
61
-
62
-
63
-
64
-
65
-
66
-
67
-
68
-
69
-
70
-
71
-
72
-
73
-
74
-
75
-
76
-
77
-
78
-
79
-
80
-
81
-
82
-
83
-
84
-
85
-
86
-
87
-
88
-
89
-
90
-
91
-
92
-
93
-
94
-
95
-
96
-
97
-
98
-
99
-
100
-
101
-
102
-
103
-
104
-
105
-
106
-
107
-
108
-
109
-
110
-
111
-
112
-
113
-
114
-
115
-
116
-
117
-
118
-
119
-
120
-
121
-
122
-
123
-
124
-
125
-
126
-
127
-
128
-
129
-
130
-
131
-
132
-
133
-
134
-
135
-
136
-
137
-
138
-
139
-
140
-
141
-
142
-
143
-
144
-
145
-
146
-
147
-
148
-
149
-
150
-
151
-
152
-
153
-
154
-
155
-
156
-
157
-
158
-
159
-
160
-
161
-
162
-
163
-
164
-
165
-
166
-
167
-
168
-
169
-
170
-
171
-
172
-
173
-
174
-
175
-
176
-
177
-
178
-
179
-
180
-
181
-
182
-
183
-
184
-
185
-
 186
186 -
 187
187 -
 188
188 -
 189
189 -
 190
190 -
 191
191 -
 192
192 -
 193
193 -
 194
194 -
 195
195 -
 196
196 -
 197
197 -
 198
198 -
 199
199 -
 200
200 -
 201
201 -
 202
202 -
 203
203 -
 204
204 -
 205
205 -
 206
206 -
207
-
208
-
209
-
210
-
211
-
212
-
213
-
214
-
215
-
216
-
217
-
218
-
219
-
220
-
221
-
222
-
223
-
224
-
225
-
226
-
227
-
228
-
229
-
230
-
231
-
232
-
233
-
234
-
235
-
236
-
237
-
238
-
239
-
240
-
241
-
242
-
243
-
244
-
245
-
246
-
247
-
248
-
249
-
250
-
251
-
252
-
253
-
254
-
255
-
256
-
257
-
258
-
259
-
260
-
261
-
262
-
263
-
264
-
265
-
266
-
267
-
268
-
269
-
270
-
271
-
272
-
273
-
274
-
275
-
276
-
277
-
278
-
279
-
280
 |
 |

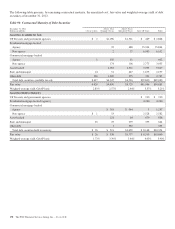
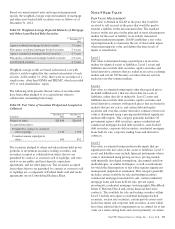
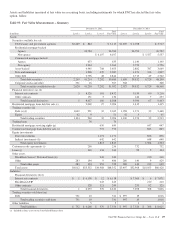
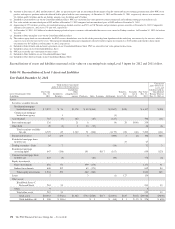
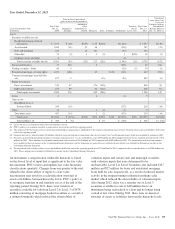
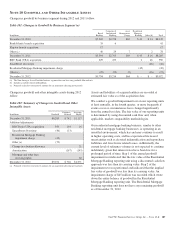
Assets and liabilities measured at fair value on a recurring basis, including instruments for which PNC has elected the fair value
option, follow.
Table 93: Fair Value Measurements – Summary
December 31, 2012 December 31, 2011
In millions Level 1 Level 2 Level 3
Total
Fair Value Level 1 Level 2 Level 3
Total
Fair Value
Assets
Securities available for sale
US Treasury and government agencies $2,269 $ 844 $ 3,113 $1,659 $ 2,058 $ 3,717
Residential mortgage-backed
Agency 26,784 26,784 26,792 26,792
Non-agency $ 6,107 6,107 $ 5,557 5,557
Commercial mortgage-backed
Agency 633 633 1,140 1,140
Non-agency 3,264 3,264 2,756 2,756
Asset-backed 4,945 708 5,653 2,882 787 3,669
State and municipal 1,948 339 2,287 1,471 336 1,807
Other debt 2,796 48 2,844 2,713 49 2,762
Total debt securities 2,269 41,214 7,202 50,685 1,659 39,812 6,729 48,200
Corporate stocks and other 351 16 367 368 368
Total securities available for sale 2,620 41,230 7,202 51,052 2,027 39,812 6,729 48,568
Financial derivatives (a) (b)
Interest rate contracts 5 8,326 101 8,432 9,150 60 9,210
Other contracts 131 5 136 246 7 253
Total financial derivatives 5 8,457 106 8,568 9,396 67 9,463
Residential mortgage loans held for sale (c) 2,069 27 2,096 1,415 1,415
Trading securities (d)
Debt (e) (f) 1,062 951 32 2,045 1,058 1,371 39 2,468
Equity 42 9 51 42 3 45
Total trading securities 1,104 960 32 2,096 1,100 1,374 39 2,513
Trading loans 76 76
Residential mortgage servicing rights (g) 650 650 647 647
Commercial mortgage loans held for sale (c) 772 772 843 843
Equity investments
Direct investments 1,171 1,171 856 856
Indirect investments (h) 642 642 648 648
Total equity investments 1,813 1,813 1,504 1,504
Customer resale agreements (i) 256 256 732 732
Loans (j) 110 134 244 99 5 104
Other assets
BlackRock Series C Preferred Stock (k) 243 243 210 210
Other 283 194 9 486 280 140 9 429
Total other assets 283 194 252 729 280 140 219 639
Total assets $4,012 $53,352 $10,988 $68,352 $3,407 $52,968 $10,053 $66,428
Liabilities
Financial derivatives (b) (l)
Interest rate contracts $ 1 $ 6,105 $ 12 $ 6,118 $ 7,065 $ 6 $ 7,071
BlackRock LTIP 243 243 210 210
Other contracts 128 121 249 233 92 325
Total financial derivatives 1 6,233 376 6,610 7,298 308 7,606
Trading securities sold short (m)
Debt 731 10 741 $ 997 19 1,016
Total trading securities sold short 731 10 741 997 19 1,016
Other liabilities 5 5 3 3
Total liabilities $ 732 $ 6,248 $ 376 $ 7,356 $ 997 $ 7,320 $ 308 $ 8,625
(a) Included in Other assets on our Consolidated Balance Sheet.
The PNC Financial Services Group, Inc. – Form 10-K 177