PNC Bank 2012 Annual Report Download - page 76
Download and view the complete annual report
Please find page 76 of the 2012 PNC Bank annual report below. You can navigate through the pages in the report by either clicking on the pages listed below, or by using the keyword search tool below to find specific information within the annual report.-
 1
1 -
2
-
3
-
4
-
5
-
6
-
7
-
8
-
9
-
10
-
11
-
12
-
13
-
14
-
15
-
16
-
17
-
18
-
19
-
20
-
21
-
22
-
23
-
24
-
25
-
26
-
27
-
28
-
29
-
30
-
31
-
32
-
33
-
34
-
35
-
36
-
37
-
38
-
39
-
40
-
41
-
42
-
43
-
44
-
45
-
46
-
47
-
48
-
49
-
50
-
51
-
52
-
53
-
54
-
55
-
56
-
57
-
58
-
59
-
60
-
61
-
62
-
63
-
64
-
65
-
 66
66 -
 67
67 -
 68
68 -
 69
69 -
 70
70 -
 71
71 -
 72
72 -
 73
73 -
 74
74 -
 75
75 -
 76
76 -
 77
77 -
 78
78 -
 79
79 -
 80
80 -
 81
81 -
 82
82 -
 83
83 -
 84
84 -
 85
85 -
 86
86 -
87
-
88
-
89
-
90
-
91
-
92
-
93
-
94
-
95
-
96
-
97
-
98
-
99
-
100
-
101
-
102
-
103
-
104
-
105
-
106
-
107
-
108
-
109
-
110
-
111
-
112
-
113
-
114
-
115
-
116
-
117
-
118
-
119
-
120
-
121
-
122
-
123
-
124
-
125
-
126
-
127
-
128
-
129
-
130
-
131
-
132
-
133
-
134
-
135
-
136
-
137
-
138
-
139
-
140
-
141
-
142
-
143
-
144
-
145
-
146
-
147
-
148
-
149
-
150
-
151
-
152
-
153
-
154
-
155
-
156
-
157
-
158
-
159
-
160
-
161
-
162
-
163
-
164
-
165
-
166
-
167
-
168
-
169
-
170
-
171
-
172
-
173
-
174
-
175
-
176
-
177
-
178
-
179
-
180
-
181
-
182
-
183
-
184
-
185
-
186
-
187
-
188
-
189
-
190
-
191
-
192
-
193
-
194
-
195
-
196
-
197
-
198
-
199
-
200
-
201
-
202
-
203
-
204
-
205
-
206
-
207
-
208
-
209
-
210
-
211
-
212
-
213
-
214
-
215
-
216
-
217
-
218
-
219
-
220
-
221
-
222
-
223
-
224
-
225
-
226
-
227
-
228
-
229
-
230
-
231
-
232
-
233
-
234
-
235
-
236
-
237
-
238
-
239
-
240
-
241
-
242
-
243
-
244
-
245
-
246
-
247
-
248
-
249
-
250
-
251
-
252
-
253
-
254
-
255
-
256
-
257
-
258
-
259
-
260
-
261
-
262
-
263
-
264
-
265
-
266
-
267
-
268
-
269
-
270
-
271
-
272
-
273
-
274
-
275
-
276
-
277
-
278
-
279
-
280
 |
 |
B
USINESS
S
EGMENTS
R
EVIEW
We have six reportable business segments:
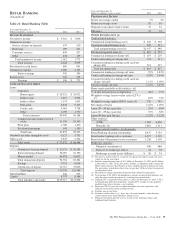
• Retail Banking
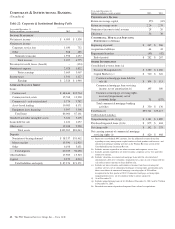
• Corporate & Institutional Banking
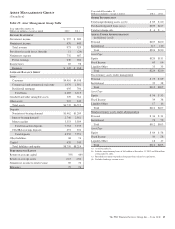
• Asset Management Group
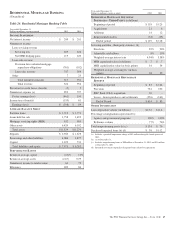
• Residential Mortgage Banking
• BlackRock
• Non-Strategic Assets Portfolio
Business segment results, including inter-segment revenues,
and a description of each business are included in Note 26
Segment Reporting included in the Notes To Consolidated
Financial Statements in Item 8 of this Report. Certain amounts
included in this Item 7 differ from those amounts shown in
Note 26 primarily due to the presentation in this Business
Segments Review of business net interest revenue on a
taxable-equivalent basis.
Results of individual businesses are presented based on our
internal management reporting practices. There is no
comprehensive, authoritative body of guidance for
management accounting equivalent to GAAP; therefore, the
financial results of our individual businesses are not
necessarily comparable with similar information for any other
company. We periodically refine our internal methodologies
as management reporting practices are enhanced. To the
extent practicable, retrospective application of new
methodologies is made to prior period reportable business
segment results and disclosures to create comparability to the
current period presentation to reflect any such refinements.
Financial results are presented, to the extent practicable, as if
each business operated on a stand-alone basis. We have
aggregated the business results for certain similar operating
segments for financial reporting purposes.
Assets receive a funding charge and liabilities and capital
receive a funding credit based on a transfer pricing
methodology that incorporates product maturities, duration
and other factors. During the second quarter of 2012,
enhancements were made to the funds transfer pricing
methodology. Retrospective application of our new funds
transfer pricing methodology has been made to the prior
period reportable business segment results and disclosures to
create comparability to the current period presentation, which
we believe is more meaningful to readers of our financial
statements.
A portion of capital is intended to cover unexpected losses and
is assigned to our business segments using our risk-based
economic capital model, including consideration of the
goodwill and other intangible assets at those business
segments, as well as the diversification of risk among the
business segments.
We have allocated the allowances for loan and lease losses
and for unfunded loan commitments and letters of credit based
on our assessment of risk in the business segment loan
portfolios. Our allocation of the costs incurred by operations
and other shared support areas not directly aligned with the
businesses is primarily based on the use of services. Key
reserve assumptions and estimation processes react to and are
influenced by observed changes in loan portfolio performance
experience, the financial strength of the borrower, and
economic conditions. Key reserve assumptions are
periodically updated. During the third quarter of 2012, PNC
increased the amount of internally observed data used in
estimating the key commercial lending assumptions of PDs
and LGDs. The estimated impact as of the beginning of the
third quarter 2012 was approximately an increase of $41
million and a decrease of $55 million to the provision for
credit losses of Retail Banking and Corporate & Institutional
Banking, respectively. Prior periods are not presented on a
comparable basis as it is not practicable to do so.
Total business segment financial results differ from
consolidated income from continuing operations before
noncontrolling interests. The impact of these differences is
reflected in the “Other” category. “Other” for purposes of this
Business Segments Review and the Business Segment
Highlights in the Executive Summary includes residual
activities that do not meet the criteria for disclosure as a
separate reportable business, such as gains or losses related to
BlackRock transactions, integration costs, asset and liability
management activities including net securities gains or losses,
other-than-temporary impairment of investment securities and
certain trading activities, exited businesses, alternative
investments including private equity, intercompany
eliminations, most corporate overhead, tax adjustments that
are not allocated to business segments and differences
between business segment performance reporting and
financial statement reporting (GAAP), including the
presentation of net income attributable to noncontrolling
interests as the segments’ results exclude their portion of net
income attributable to noncontrolling interests.
The PNC Financial Services Group, Inc. – Form 10-K 57