PNC Bank 2012 Annual Report Download - page 250
Download and view the complete annual report
Please find page 250 of the 2012 PNC Bank annual report below. You can navigate through the pages in the report by either clicking on the pages listed below, or by using the keyword search tool below to find specific information within the annual report.-
 1
1 -
2
-
3
-
4
-
5
-
6
-
7
-
8
-
9
-
10
-
11
-
12
-
13
-
14
-
15
-
16
-
17
-
18
-
19
-
20
-
21
-
22
-
23
-
24
-
25
-
26
-
27
-
28
-
29
-
30
-
31
-
32
-
33
-
34
-
35
-
36
-
37
-
38
-
39
-
40
-
41
-
42
-
43
-
44
-
45
-
46
-
47
-
48
-
49
-
50
-
51
-
52
-
53
-
54
-
55
-
56
-
57
-
58
-
59
-
60
-
61
-
62
-
63
-
64
-
65
-
66
-
67
-
68
-
69
-
70
-
71
-
72
-
73
-
74
-
75
-
76
-
77
-
78
-
79
-
80
-
81
-
82
-
83
-
84
-
85
-
86
-
87
-
88
-
89
-
90
-
91
-
92
-
93
-
94
-
95
-
96
-
97
-
98
-
99
-
100
-
101
-
102
-
103
-
104
-
105
-
106
-
107
-
108
-
109
-
110
-
111
-
112
-
113
-
114
-
115
-
116
-
117
-
118
-
119
-
120
-
121
-
122
-
123
-
124
-
125
-
126
-
127
-
128
-
129
-
130
-
131
-
132
-
133
-
134
-
135
-
136
-
137
-
138
-
139
-
140
-
141
-
142
-
143
-
144
-
145
-
146
-
147
-
148
-
149
-
150
-
151
-
152
-
153
-
154
-
155
-
156
-
157
-
158
-
159
-
160
-
161
-
162
-
163
-
164
-
165
-
166
-
167
-
168
-
169
-
170
-
171
-
172
-
173
-
174
-
175
-
176
-
177
-
178
-
179
-
180
-
181
-
182
-
183
-
184
-
185
-
186
-
187
-
188
-
189
-
190
-
191
-
192
-
193
-
194
-
195
-
196
-
197
-
198
-
199
-
200
-
201
-
202
-
203
-
204
-
205
-
206
-
207
-
208
-
209
-
210
-
211
-
212
-
213
-
214
-
215
-
216
-
217
-
218
-
219
-
220
-
221
-
222
-
223
-
224
-
225
-
226
-
227
-
228
-
229
-
230
-
231
-
232
-
233
-
234
-
235
-
236
-
237
-
238
-
239
-
 240
240 -
 241
241 -
 242
242 -
 243
243 -
 244
244 -
 245
245 -
 246
246 -
 247
247 -
 248
248 -
 249
249 -
 250
250 -
 251
251 -
 252
252 -
 253
253 -
 254
254 -
 255
255 -
 256
256 -
 257
257 -
 258
258 -
 259
259 -
 260
260 -
261
-
262
-
263
-
264
-
265
-
266
-
267
-
268
-
269
-
270
-
271
-
272
-
273
-
274
-
275
-
276
-
277
-
278
-
279
-
280
 |
 |

N
OTE
25 P
ARENT
C
OMPANY
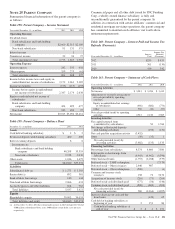
Summarized financial information of the parent company is
as follows:
Table 158: Parent Company – Income Statement
Year ended December 31 – in millions 2012 2011 2010
Operating Revenue
Dividends from:
Bank subsidiaries and bank holding
company $2,660 $2,513 $2,180
Non-bank subsidiaries 91 131 575
Interest income 1
Noninterest income 22 24 27
Total operating revenue 2,773 2,669 2,782
Operating Expense
Interest expense 242 333 458
Other expense 359 275 (61)
Total operating expense 601 608 397
Income before income taxes and equity in
undistributed net income of subsidiaries 2,172 2,061 2,385
Income tax benefits (175) (113) (253)
Income before equity in undistributed
net income of subsidiaries 2,347 2,174 2,638
Equity in undistributed net income of
subsidiaries:
Bank subsidiaries and bank holding
company 424 699 677
Non-bank subsidiaries 242 183 97
Net income $3,013 $3,056 $3,412
Table 159: Parent Company – Balance Sheet
December 31 – in millions 2012 2011
Assets
Cash held at banking subsidiary $ 2 $ 2
Restricted deposits with banking subsidiary 400 400
Interest-earning deposits 6 6
Investments in:
Bank subsidiaries and bank holding
company 40,208 35,355
Non-bank subsidiaries 2,238 2,036
Other assets 1,186 1,675
Total assets $44,040 $39,474
Liabilities
Subordinated debt (a) $ 1,275 $ 3,303
Senior debt (a) 892 381
Bank affiliate borrowings 140 144
Non-bank affiliate borrowings 2,066 631
Accrued expenses and other liabilities 664 962
Total liabilities 5,037 5,421
Equity
Shareholder’s equity 39,003 34,053
Total liabilities and equity $44,040 $39,474
(a) At December 31, 2012, debt that contractually matures in 2013 through 2017 totaled
$300 million (subordinated debt), zero, $400 million (senior debt), zero and zero,
respectively.
Commercial paper and all other debt issued by PNC Funding
Corp, a wholly owned finance subsidiary, is fully and
unconditionally guaranteed by the parent company. In
addition, in connection with certain affiliates’ commercial and
residential mortgage servicing operations, the parent company
has committed to maintain such affiliates’ net worth above
minimum requirements.
Table 160: Parent Company – Interest Paid and Income Tax
Refunds (Payments)
Year ended December 31 – in millions
Interest
Paid
Income Tax
Refunds /
(Payments)
2012 $255 $ 453
2011 361 (130)
2010 419 342
Table 161: Parent Company – Statement of Cash Flows
Year ended December 31 – in millions 2012 2011 2010
Operating Activities
Net income $ 3,013 $ 3,056 $ 3,412
Adjustments to reconcile net income to
net cash provided by operating
activities:
Equity in undistributed net earnings
of subsidiaries (666) (882) (774)
Other 566 (24) (53)
Net cash provided (used) by operating
activities 2,913 2,150 2,585
Investing Activities
Net capital returned from
(contributed to) subsidiaries 50 1,766
Net change in Restricted deposits
with banking subsidiary (150) (232)
Net cash paid for acquisition activity (3,432)
Other (50) (35) 1
Net cash provided (used) by
investing activities (3,482) (135) 1,535
Financing Activities
Borrowings from subsidiaries 8,374 4,660 7,580
Repayments on borrowings from
subsidiaries (6,943) (4,962) (6,596)
Other borrowed funds (1,753) (2,188) (379)
Preferred stock – TARP redemption (7,579)
Preferred stock – Other issuances 2,446 987
Preferred stock – Other redemptions (500) (1)
Common and treasury stock
issuances 158 72 3,474
Acquisition of treasury stock (216) (73) (204)
Preferred stock cash dividends paid (177) (56) (146)
Common stock cash dividends paid (820) (604) (204)
Net cash provided (used) by
financing activities 569 (2,164) (4,055)
Increase (decrease) in cash and due
from banks – (149) 65
Cash held at banking subsidiary at
beginning of year 2 151 86
Cash held at banking subsidiary at
end of year $ 2 $ 2 $ 151
The PNC Financial Services Group, Inc. – Form 10-K 231