PNC Bank 2012 Annual Report Download - page 209
Download and view the complete annual report
Please find page 209 of the 2012 PNC Bank annual report below. You can navigate through the pages in the report by either clicking on the pages listed below, or by using the keyword search tool below to find specific information within the annual report.-
 1
1 -
2
-
3
-
4
-
5
-
6
-
7
-
8
-
9
-
10
-
11
-
12
-
13
-
14
-
15
-
16
-
17
-
18
-
19
-
20
-
21
-
22
-
23
-
24
-
25
-
26
-
27
-
28
-
29
-
30
-
31
-
32
-
33
-
34
-
35
-
36
-
37
-
38
-
39
-
40
-
41
-
42
-
43
-
44
-
45
-
46
-
47
-
48
-
49
-
50
-
51
-
52
-
53
-
54
-
55
-
56
-
57
-
58
-
59
-
60
-
61
-
62
-
63
-
64
-
65
-
66
-
67
-
68
-
69
-
70
-
71
-
72
-
73
-
74
-
75
-
76
-
77
-
78
-
79
-
80
-
81
-
82
-
83
-
84
-
85
-
86
-
87
-
88
-
89
-
90
-
91
-
92
-
93
-
94
-
95
-
96
-
97
-
98
-
99
-
100
-
101
-
102
-
103
-
104
-
105
-
106
-
107
-
108
-
109
-
110
-
111
-
112
-
113
-
114
-
115
-
116
-
117
-
118
-
119
-
120
-
121
-
122
-
123
-
124
-
125
-
126
-
127
-
128
-
129
-
130
-
131
-
132
-
133
-
134
-
135
-
136
-
137
-
138
-
139
-
140
-
141
-
142
-
143
-
144
-
145
-
146
-
147
-
148
-
149
-
150
-
151
-
152
-
153
-
154
-
155
-
156
-
157
-
158
-
159
-
160
-
161
-
162
-
163
-
164
-
165
-
166
-
167
-
168
-
169
-
170
-
171
-
172
-
173
-
174
-
175
-
176
-
177
-
178
-
179
-
180
-
181
-
182
-
183
-
184
-
185
-
186
-
187
-
188
-
189
-
190
-
191
-
192
-
193
-
194
-
195
-
196
-
197
-
198
-
 199
199 -
 200
200 -
 201
201 -
 202
202 -
 203
203 -
 204
204 -
 205
205 -
 206
206 -
 207
207 -
 208
208 -
 209
209 -
 210
210 -
 211
211 -
 212
212 -
 213
213 -
 214
214 -
 215
215 -
 216
216 -
 217
217 -
 218
218 -
 219
219 -
220
-
221
-
222
-
223
-
224
-
225
-
226
-
227
-
228
-
229
-
230
-
231
-
232
-
233
-
234
-
235
-
236
-
237
-
238
-
239
-
240
-
241
-
242
-
243
-
244
-
245
-
246
-
247
-
248
-
249
-
250
-
251
-
252
-
253
-
254
-
255
-
256
-
257
-
258
-
259
-
260
-
261
-
262
-
263
-
264
-
265
-
266
-
267
-
268
-
269
-
270
-
271
-
272
-
273
-
274
-
275
-
276
-
277
-
278
-
279
-
280
 |
 |

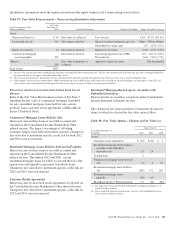
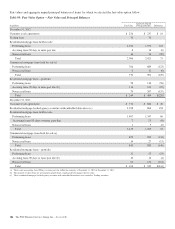
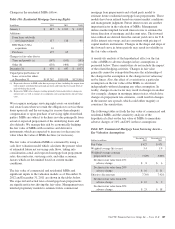
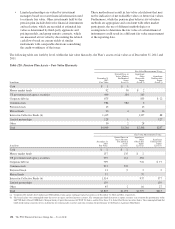
Table 108: Residential Mortgage Loan Servicing Assets –
Key Valuation Assumptions
Dollars in millions
December 31
2012
December 31
2011
Fair value $ 650 $ 647
Weighted-average life (years) 4.3 3.6
Weighted-average constant
prepayment rate 18.78% 22.10%
Decline in fair value from 10%
adverse change $ 45 $ 44
Decline in fair value from 20%
adverse change $ 85 $ 84
Weighted-average option adjusted
spread 11.15% 11.77%
Decline in fair value from 10%
adverse change $ 26 $ 25
Decline in fair value from 20%
adverse change $ 49 $ 48
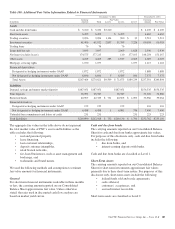
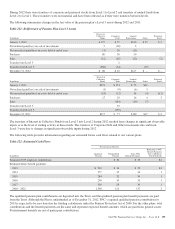
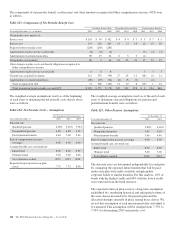
Fees from mortgage and other loan servicing comprised of
contractually specified servicing fees, including late fees and
ancillary fees, follows:
Table 109: Fees from Mortgage and Other Loan Servicing
In millions 2012 2011 2010
Fees from mortgage and other loan
servicing $557 $641 $692
We also generate servicing fees from fee-based activities
provided to others for which we do not have an associated
servicing asset.
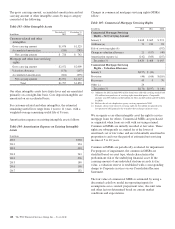
Fees from commercial MSRs, residential MSRs and other loan
servicing are reported on our Consolidated Income Statement
in the line items Corporate services, Residential mortgage, and
Consumer services, respectively.
N
OTE
11 P
REMISES
,E
QUIPMENT AND
L
EASEHOLD
I
MPROVEMENTS
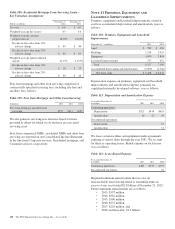
Premises, equipment and leasehold improvements, stated at
cost less accumulated depreciation and amortization, were as
follows:
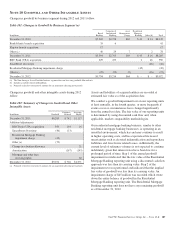
Table 110: Premises, Equipment and Leasehold
Improvements
December 31 - in millions 2012 2011
Land $ 782 $ 690
Buildings 2,218 1,955
Equipment 4,590 3,894
Leasehold improvements 747 651
Total 8,337 7,190
Accumulated depreciation and amortization (2,909) (2,546)
Net book value $ 5,428 $ 4,644
Depreciation expense on premises, equipment and leasehold
improvements and amortization expense, primarily for
capitalized internally developed software, was as follows:
Table 111: Depreciation and Amortization Expense
Year ended December 31
in millions 2012 2011 2010
Continuing operations:
Depreciation $521 $474 $455
Amortization 19 22 45
Discontinued operations:
Depreciation 12
Amortization 11
We lease certain facilities and equipment under agreements
expiring at various dates through the year 2081. We account
for these as operating leases. Rental expense on such leases
was as follows:
Table 112: Lease Rental Expense
Year ended December 31
in millions 2012 2011 2010
Continuing operations: $405 $357 $379
Discontinued operations: 10
Required minimum annual rentals that we owe on
noncancelable leases having initial or remaining terms in
excess of one year totaled $2.8 billion at December 31, 2012.
Future minimum annual rentals are as follows:
• 2013: $397 million,
• 2014: $362 million,
• 2015: $306 million,
• 2016: $252 million,
• 2017: $220 million, and
• 2018 and thereafter: $1.3 billion.
190 The PNC Financial Services Group, Inc. – Form 10-K