PNC Bank 2012 Annual Report Download - page 9
Download and view the complete annual report
Please find page 9 of the 2012 PNC Bank annual report below. You can navigate through the pages in the report by either clicking on the pages listed below, or by using the keyword search tool below to find specific information within the annual report.-
 1
1 -
 2
2 -
 3
3 -
 4
4 -
 5
5 -
 6
6 -
 7
7 -
 8
8 -
 9
9 -
 10
10 -
 11
11 -
 12
12 -
 13
13 -
 14
14 -
 15
15 -
 16
16 -
 17
17 -
 18
18 -
 19
19 -
 20
20 -
 21
21 -
 22
22 -
 23
23 -
 24
24 -
 25
25 -
 26
26 -
 27
27 -
 28
28 -
 29
29 -
 30
30 -
 31
31 -
 32
32 -
 33
33 -
 34
34 -
 35
35 -
 36
36 -
 37
37 -
 38
38 -
 39
39 -
 40
40 -
 41
41 -
 42
42 -
 43
43 -
 44
44 -
 45
45 -
 46
46 -
 47
47 -
 48
48 -
 49
49 -
 50
50 -
 51
51 -
 52
52 -
 53
53 -
 54
54 -
 55
55 -
 56
56 -
 57
57 -
 58
58 -
 59
59 -
 60
60 -
 61
61 -
 62
62 -
 63
63 -
 64
64 -
 65
65 -
 66
66 -
 67
67 -
 68
68 -
 69
69 -
 70
70 -
 71
71 -
 72
72 -
 73
73 -
 74
74 -
 75
75 -
 76
76 -
 77
77 -
 78
78 -
 79
79 -
 80
80 -
 81
81 -
 82
82 -
 83
83 -
 84
84 -
 85
85 -
 86
86 -
 87
87 -
 88
88 -
 89
89 -
 90
90 -
 91
91 -
 92
92 -
 93
93 -
 94
94 -
 95
95 -
 96
96 -
 97
97 -
 98
98 -
 99
99 -
 100
100 -
 101
101 -
 102
102 -
 103
103 -
 104
104 -
 105
105 -
 106
106 -
 107
107 -
 108
108 -
 109
109 -
 110
110 -
 111
111 -
 112
112 -
 113
113 -
 114
114 -
 115
115 -
 116
116 -
 117
117 -
 118
118 -
 119
119 -
 120
120 -
 121
121 -
 122
122 -
 123
123 -
 124
124 -
 125
125 -
 126
126 -
 127
127 -
 128
128 -
 129
129 -
 130
130 -
 131
131 -
 132
132 -
 133
133 -
 134
134 -
 135
135 -
 136
136 -
 137
137 -
 138
138 -
 139
139 -
 140
140 -
 141
141 -
 142
142 -
 143
143 -
 144
144 -
 145
145 -
 146
146 -
 147
147 -
 148
148 -
 149
149 -
 150
150 -
 151
151 -
 152
152 -
 153
153 -
 154
154 -
 155
155 -
 156
156 -
 157
157 -
 158
158 -
 159
159 -
 160
160 -
 161
161 -
 162
162 -
 163
163 -
 164
164 -
 165
165 -
 166
166 -
 167
167 -
 168
168 -
 169
169 -
 170
170 -
 171
171 -
 172
172 -
 173
173 -
 174
174 -
 175
175 -
 176
176 -
 177
177 -
 178
178 -
 179
179 -
 180
180 -
 181
181 -
 182
182 -
 183
183 -
 184
184 -
 185
185 -
 186
186 -
 187
187 -
 188
188 -
 189
189 -
 190
190 -
 191
191 -
 192
192 -
 193
193 -
 194
194 -
 195
195 -
 196
196 -
 197
197 -
 198
198 -
 199
199 -
 200
200 -
 201
201 -
 202
202 -
 203
203 -
 204
204 -
 205
205 -
 206
206 -
 207
207 -
 208
208 -
 209
209 -
 210
210 -
 211
211 -
 212
212 -
 213
213 -
 214
214 -
 215
215 -
 216
216 -
 217
217 -
 218
218 -
 219
219 -
 220
220 -
 221
221 -
 222
222 -
 223
223 -
 224
224 -
 225
225 -
 226
226 -
 227
227 -
 228
228 -
 229
229 -
 230
230 -
 231
231 -
 232
232 -
 233
233 -
 234
234 -
 235
235 -
 236
236 -
 237
237 -
 238
238 -
 239
239 -
 240
240 -
 241
241 -
 242
242 -
 243
243 -
 244
244 -
 245
245 -
 246
246 -
 247
247 -
 248
248 -
 249
249 -
 250
250 -
 251
251 -
 252
252 -
 253
253 -
 254
254 -
 255
255 -
 256
256 -
 257
257 -
 258
258 -
 259
259 -
 260
260 -
 261
261 -
 262
262 -
 263
263 -
 264
264 -
 265
265 -
 266
266 -
 267
267 -
 268
268 -
 269
269 -
 270
270 -
 271
271 -
 272
272 -
 273
273 -
 274
274 -
 275
275 -
 276
276 -
 277
277 -
 278
278 -
 279
279 -
 280
280
 |
 |

These priorities along with our commitment to executing give us confidence that we can deliver
shareholder value in 2013.
* PNC believes that tangible book value per common share, a non-GAAP measure, is useful as a tool to help to better evaluate growth of
a company’s business apart from the amount, on a per share basis, of intangible assets other than servicing rights included in book value
per common share. PNC’s book value per share was $67.05 at year-end 2012, a 41% increase over $47.68 at year-end 2009. Subtracting
approximately $9.8 billion ($10.9 billion of goodwill and other intangible assets less $1.1 billion of servicing rights) or $18.54 per share
for year-end 2012, and subtracting approximately $10.7 billion ($12.9 billion of goodwill and other intangible assets less $2.2 billion of
servicing rights) or $23.09 per share for year-end 2009, results in tangible book value per share of approximately $48.51 for year-end 2012,
a 97% increase over approximately $24.59 at year-end 2009.
PNC’s 2012 peer group consists of BB&T Corporation, Bank of America Corporation, Capital One Financial Corporation, Comerica
Incorporated, Fifth Third Bancorp, JPMorgan Chase & Co., KeyCorp, M&T Bank Corporation, The PNC Financial Services Group, Inc.,
Regions Financial Corporation, SunTrust Banks, Inc., U.S. Bancorp, and Wells Fargo & Company.
MANAGE RISK, EXPENSES AND CAPITAL.
Managing credit risk remains a priority for us.
Our nonperforming assets declined from year
end 2011, and our provision for credit losses
and net charge-offs improved in 2012. Overall,
we remain committed to a moderate risk
philosophy.
At PNC, expense management is a part of
our culture, and we have a track record of
executing on our objectives. For 2013 we
increased our continuous improvement
target to $700 million, with the overall goal of
achieving full-year positive operating leverage
on a reported basis and producing stronger
results in 2013.
Our Tier 1 common capital ratio was 9.6
percent as of December 31, 2012, and our
estimated Basel III Tier 1 common capital
ratio on a pro forma basis as of that date was
7.5 percent. Of course that is based on our
current understanding of Basel rules and other
estimates. It remains our goal to be within the
range of 8.0 to 8.5 percent by year-end 2013
without benefit of phase-ins, and we believe
we can get there primarily based on increased
retained earnings in 2013.
Since the financial crisis began in 2008, we
have made strategic decisions to use capital
to grow our franchise for the long term. Over
time, we believe the opportunities associated
with these acquisitions should provide our
shareholders with strong returns.
Our earnings and capital strength supported
our decision to increase the common stock
dividend in the first quarter of 2012 for the
second time in as many years. Our dividend
yield as of December 31, 2012, was 2.76
percent, which we believe makes PNC stock
very attractive in the current low interest rate
environment.
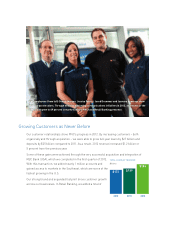
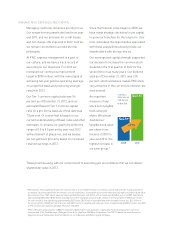
An important
measure of any
stock is its tangible
book value per
share. We almost
doubled our
tangible book value
per share from
the end of 2009 to
year-end 2012, the
highest increase in
our peer group.*
2009 2012
$24.59
$48.51
TANGIBLE
BOOK VALUE
PER SHARE
At Year End
+97%
