PNC Bank 2012 Annual Report Download - page 85
Download and view the complete annual report
Please find page 85 of the 2012 PNC Bank annual report below. You can navigate through the pages in the report by either clicking on the pages listed below, or by using the keyword search tool below to find specific information within the annual report.-
 1
1 -
2
-
3
-
4
-
5
-
6
-
7
-
8
-
9
-
10
-
11
-
12
-
13
-
14
-
15
-
16
-
17
-
18
-
19
-
20
-
21
-
22
-
23
-
24
-
25
-
26
-
27
-
28
-
29
-
30
-
31
-
32
-
33
-
34
-
35
-
36
-
37
-
38
-
39
-
40
-
41
-
42
-
43
-
44
-
45
-
46
-
47
-
48
-
49
-
50
-
51
-
52
-
53
-
54
-
55
-
56
-
57
-
58
-
59
-
60
-
61
-
62
-
63
-
64
-
65
-
66
-
67
-
68
-
69
-
70
-
71
-
72
-
73
-
74
-
 75
75 -
 76
76 -
 77
77 -
 78
78 -
 79
79 -
 80
80 -
 81
81 -
 82
82 -
 83
83 -
 84
84 -
 85
85 -
 86
86 -
 87
87 -
 88
88 -
 89
89 -
 90
90 -
 91
91 -
 92
92 -
 93
93 -
 94
94 -
 95
95 -
96
-
97
-
98
-
99
-
100
-
101
-
102
-
103
-
104
-
105
-
106
-
107
-
108
-
109
-
110
-
111
-
112
-
113
-
114
-
115
-
116
-
117
-
118
-
119
-
120
-
121
-
122
-
123
-
124
-
125
-
126
-
127
-
128
-
129
-
130
-
131
-
132
-
133
-
134
-
135
-
136
-
137
-
138
-
139
-
140
-
141
-
142
-
143
-
144
-
145
-
146
-
147
-
148
-
149
-
150
-
151
-
152
-
153
-
154
-
155
-
156
-
157
-
158
-
159
-
160
-
161
-
162
-
163
-
164
-
165
-
166
-
167
-
168
-
169
-
170
-
171
-
172
-
173
-
174
-
175
-
176
-
177
-
178
-
179
-
180
-
181
-
182
-
183
-
184
-
185
-
186
-
187
-
188
-
189
-
190
-
191
-
192
-
193
-
194
-
195
-
196
-
197
-
198
-
199
-
200
-
201
-
202
-
203
-
204
-
205
-
206
-
207
-
208
-
209
-
210
-
211
-
212
-
213
-
214
-
215
-
216
-
217
-
218
-
219
-
220
-
221
-
222
-
223
-
224
-
225
-
226
-
227
-
228
-
229
-
230
-
231
-
232
-
233
-
234
-
235
-
236
-
237
-
238
-
239
-
240
-
241
-
242
-
243
-
244
-
245
-
246
-
247
-
248
-
249
-
250
-
251
-
252
-
253
-
254
-
255
-
256
-
257
-
258
-
259
-
260
-
261
-
262
-
263
-
264
-
265
-
266
-
267
-
268
-
269
-
270
-
271
-
272
-
273
-
274
-
275
-
276
-
277
-
278
-
279
-
280
 |
 |
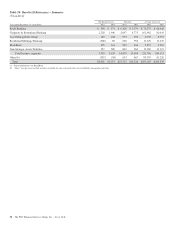
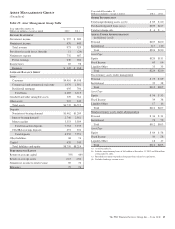
Asset Management Group earned $145 million in 2012
compared with $168 million in 2011. Revenue increased $44
million in the year over year comparison as strong sales and
higher average equity markets increased noninterest income
by 4% and higher average deposit balances increased net
interest income by 6%. The revenue increase was offset by
higher noninterest expense from strategic business
investments and higher provision for credit losses. During
2012 the business continued to focus on client acquisition and
asset and revenue growth.
The core growth strategies for the business continue to
include: investing in higher growth geographies including the
Southeast region, increasing internal referral sales and adding
new front line sales staff throughout our footprint. For 2012,
the business delivered strong sales production, grew high
value clients and benefited from significant referrals from
other PNC lines of business. Over time, the successful
execution of these strategies and the accumulation of our
strong sales performance are expected to create meaningful
growth in assets under management and noninterest income.
Highlights of Asset Management Group’s performance during
2012 include the following:
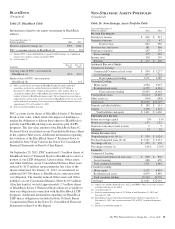
• Assets under administration of $224 billion with
positive net flows of $2.5 billion in discretionary
assets under management after adjustments to total
net flows for cyclical client activities,
• Strong sales production, up 32% over the prior year
including a 37% increase in the acquisition of new
primary clients,
• Significant referrals from other PNC lines of
business, reflecting an increase of approximately
39% over 2011,
• Continuing levels of new business investment and
focused hiring to drive growth, with over 360
external new hires, and
• PNC Wealth Insight®was awarded a “2012 CIO 100
Award” by CIO Magazine. The online client
reporting tool now enables clients to view their PNC
Investments brokerage accounts and access all client
information through a mobile application that
supports a number of smartphone platforms.
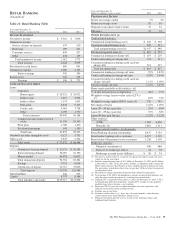
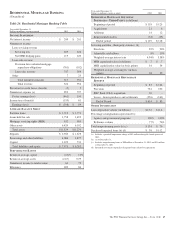
Assets under administration increased to $224 billion at
December 31, 2012 from $210 billion at December 31, 2011.
Discretionary assets under management were $112 billion at
December 31, 2012 compared with $107 billion at
December 31, 2011. The increase in the comparisons was
driven by stronger average equity markets, positive net flows,
and strong sales performance.
Total revenue for 2012 was $973 million compared with $929
million for 2011. Noninterest income was $676 million for
2012, an increase of $27 million from the prior year
attributable to stronger average equity markets, increased sales
and new client acquisition. Net interest income was $297
million for 2012 compared with $280 million for 2011. The
increase was primarily a result of growth in transaction
deposit balances.
Provision for credit losses of $11 million in 2012 increased
$35 million compared to a benefit of $24 million for 2011.
Noninterest expense was $732 million in 2012, an increase of
$45 million, or 7%, from the prior year. The increase was
attributable to investments in the business including the
Southeast region and higher compensation-related costs. Asset
Management Group remains focused on disciplined expense
management as it invests in these strategic growth
opportunities.
Average deposits of $8.3 billion for 2012 increased $461
million, or 6%, over the prior year. Average transaction
deposits grew 8% compared with 2011 and were partially
offset by the strategic run-off of maturing certificates of
deposit in the comparison.
Average loan balances of $6.2 billion increased $72 million,
or 1%, from the prior year primarily due to increased
consumer loan activity partially offset by decreases in
commercial and commercial real estate loans.
66 The PNC Financial Services Group, Inc. – Form 10-K