PNC Bank 2012 Annual Report Download - page 169
Download and view the complete annual report
Please find page 169 of the 2012 PNC Bank annual report below. You can navigate through the pages in the report by either clicking on the pages listed below, or by using the keyword search tool below to find specific information within the annual report.-
 1
1 -
2
-
3
-
4
-
5
-
6
-
7
-
8
-
9
-
10
-
11
-
12
-
13
-
14
-
15
-
16
-
17
-
18
-
19
-
20
-
21
-
22
-
23
-
24
-
25
-
26
-
27
-
28
-
29
-
30
-
31
-
32
-
33
-
34
-
35
-
36
-
37
-
38
-
39
-
40
-
41
-
42
-
43
-
44
-
45
-
46
-
47
-
48
-
49
-
50
-
51
-
52
-
53
-
54
-
55
-
56
-
57
-
58
-
59
-
60
-
61
-
62
-
63
-
64
-
65
-
66
-
67
-
68
-
69
-
70
-
71
-
72
-
73
-
74
-
75
-
76
-
77
-
78
-
79
-
80
-
81
-
82
-
83
-
84
-
85
-
86
-
87
-
88
-
89
-
90
-
91
-
92
-
93
-
94
-
95
-
96
-
97
-
98
-
99
-
100
-
101
-
102
-
103
-
104
-
105
-
106
-
107
-
108
-
109
-
110
-
111
-
112
-
113
-
114
-
115
-
116
-
117
-
118
-
119
-
120
-
121
-
122
-
123
-
124
-
125
-
126
-
127
-
128
-
129
-
130
-
131
-
132
-
133
-
134
-
135
-
136
-
137
-
138
-
139
-
140
-
141
-
142
-
143
-
144
-
145
-
146
-
147
-
148
-
149
-
150
-
151
-
152
-
153
-
154
-
155
-
156
-
157
-
158
-
 159
159 -
 160
160 -
 161
161 -
 162
162 -
 163
163 -
 164
164 -
 165
165 -
 166
166 -
 167
167 -
 168
168 -
 169
169 -
 170
170 -
 171
171 -
 172
172 -
 173
173 -
 174
174 -
 175
175 -
 176
176 -
 177
177 -
 178
178 -
 179
179 -
180
-
181
-
182
-
183
-
184
-
185
-
186
-
187
-
188
-
189
-
190
-
191
-
192
-
193
-
194
-
195
-
196
-
197
-
198
-
199
-
200
-
201
-
202
-
203
-
204
-
205
-
206
-
207
-
208
-
209
-
210
-
211
-
212
-
213
-
214
-
215
-
216
-
217
-
218
-
219
-
220
-
221
-
222
-
223
-
224
-
225
-
226
-
227
-
228
-
229
-
230
-
231
-
232
-
233
-
234
-
235
-
236
-
237
-
238
-
239
-
240
-
241
-
242
-
243
-
244
-
245
-
246
-
247
-
248
-
249
-
250
-
251
-
252
-
253
-
254
-
255
-
256
-
257
-
258
-
259
-
260
-
261
-
262
-
263
-
264
-
265
-
266
-
267
-
268
-
269
-
270
-
271
-
272
-
273
-
274
-
275
-
276
-
277
-
278
-
279
-
280
 |
 |
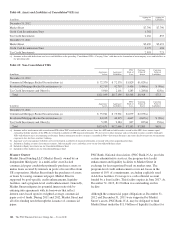
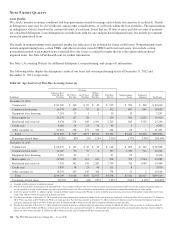
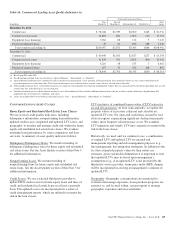
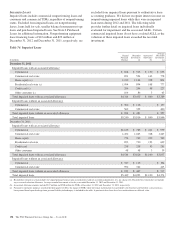
A combination of updated FICO scores, originated and
updated LTV ratios and geographic location assigned to home
equity loans and lines of credit and residential real estate loans
are used to monitor the risk in the loan classes. Loans with
higher FICO scores and lower LTVs tend to have a lower
level of risk. Conversely, loans with lower FICO scores,
higher LTVs, and in certain geographic locations tend to have
a higher level of risk.
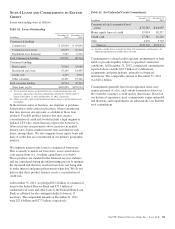
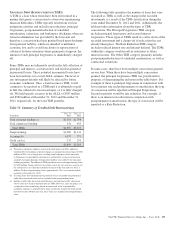
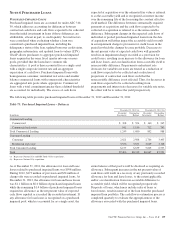
In the following table, we provide information on home equity
and residential real estate outstanding balances and recorded
investment. See Note 4 Loans and Commitments to Extend
Credit for additional information.
Table 67: Home Equity and Residential Real Estate
Balances
In millions
December 31
2012
December 31
2011
Home equity and residential real estate
loans - excluding purchased impaired
loans (a) $44,700 $41,014
Home equity and residential real estate
loans - purchased impaired loans (a) 6,639 6,533
Government insured or guaranteed
residential real estate mortgages (a) 2,231 2,884
Purchase accounting, deferred fees and
other accounting adjustments (2,410) (2,873)
Total home equity and residential real
estate loans (b) $51,160 $47,558
(a) Represents outstanding balance.
(b) Represents recorded investment.
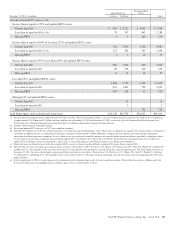
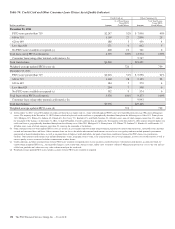
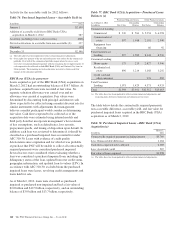
Table 68: Consumer Real Estate Secured Asset Quality Indicators – Excluding Purchased Impaired Loans (a) (b)
Home Equity
Residential
Real Estate
December 31, 2012 - in millions 1st Liens 2nd Liens Total
Current estimated LTV ratios (c) (d)
Greater than or equal to 125% and updated FICO scores:
Greater than 660 $ 600 $ 3,293 $ 856 $ 4,749
Less than or equal to 660 (e) (f) 86 756 210 1,052
Missing FICO 16 14 16 46
Greater than or equal to 100% to less than 125% and updated FICO scores:
Greater than 660 907 2,960 1,108 4,975
Less than or equal to 660 (e) (f) 139 541 250 930
Missing FICO 25 13 16 54
Greater than or equal to 90% to less than 100% and updated FICO scores:
Greater than 660 901 1,614 796 3,311
Less than or equal to 660 117 230 164 511
Missing FICO 47 33 21 101
Less than 90% and updated FICO scores:
Greater than 660 8,472 9,883 4,744 23,099
Less than or equal to 660 980 1,492 925 3,397
Missing FICO 987 225 517 1,729
Missing LTV and updated FICO scores:
Greater than 660 11
Less than or equal to 660 718
Missing FICO 737 737
Total home equity and residential real estate loans $13,277 $21,062 $10,361 $44,700
150 The PNC Financial Services Group, Inc. – Form 10-K