PNC Bank 2012 Annual Report Download - page 86
Download and view the complete annual report
Please find page 86 of the 2012 PNC Bank annual report below. You can navigate through the pages in the report by either clicking on the pages listed below, or by using the keyword search tool below to find specific information within the annual report.-
 1
1 -
2
-
3
-
4
-
5
-
6
-
7
-
8
-
9
-
10
-
11
-
12
-
13
-
14
-
15
-
16
-
17
-
18
-
19
-
20
-
21
-
22
-
23
-
24
-
25
-
26
-
27
-
28
-
29
-
30
-
31
-
32
-
33
-
34
-
35
-
36
-
37
-
38
-
39
-
40
-
41
-
42
-
43
-
44
-
45
-
46
-
47
-
48
-
49
-
50
-
51
-
52
-
53
-
54
-
55
-
56
-
57
-
58
-
59
-
60
-
61
-
62
-
63
-
64
-
65
-
66
-
67
-
68
-
69
-
70
-
71
-
72
-
73
-
74
-
75
-
 76
76 -
 77
77 -
 78
78 -
 79
79 -
 80
80 -
 81
81 -
 82
82 -
 83
83 -
 84
84 -
 85
85 -
 86
86 -
 87
87 -
 88
88 -
 89
89 -
 90
90 -
 91
91 -
 92
92 -
 93
93 -
 94
94 -
 95
95 -
 96
96 -
97
-
98
-
99
-
100
-
101
-
102
-
103
-
104
-
105
-
106
-
107
-
108
-
109
-
110
-
111
-
112
-
113
-
114
-
115
-
116
-
117
-
118
-
119
-
120
-
121
-
122
-
123
-
124
-
125
-
126
-
127
-
128
-
129
-
130
-
131
-
132
-
133
-
134
-
135
-
136
-
137
-
138
-
139
-
140
-
141
-
142
-
143
-
144
-
145
-
146
-
147
-
148
-
149
-
150
-
151
-
152
-
153
-
154
-
155
-
156
-
157
-
158
-
159
-
160
-
161
-
162
-
163
-
164
-
165
-
166
-
167
-
168
-
169
-
170
-
171
-
172
-
173
-
174
-
175
-
176
-
177
-
178
-
179
-
180
-
181
-
182
-
183
-
184
-
185
-
186
-
187
-
188
-
189
-
190
-
191
-
192
-
193
-
194
-
195
-
196
-
197
-
198
-
199
-
200
-
201
-
202
-
203
-
204
-
205
-
206
-
207
-
208
-
209
-
210
-
211
-
212
-
213
-
214
-
215
-
216
-
217
-
218
-
219
-
220
-
221
-
222
-
223
-
224
-
225
-
226
-
227
-
228
-
229
-
230
-
231
-
232
-
233
-
234
-
235
-
236
-
237
-
238
-
239
-
240
-
241
-
242
-
243
-
244
-
245
-
246
-
247
-
248
-
249
-
250
-
251
-
252
-
253
-
254
-
255
-
256
-
257
-
258
-
259
-
260
-
261
-
262
-
263
-
264
-
265
-
266
-
267
-
268
-
269
-
270
-
271
-
272
-
273
-
274
-
275
-
276
-
277
-
278
-
279
-
280
 |
 |

R
ESIDENTIAL
M
ORTGAGE
B
ANKING
(Unaudited)
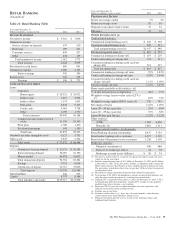
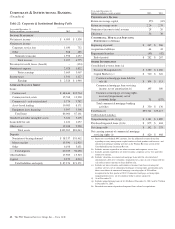
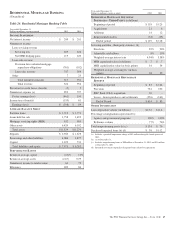
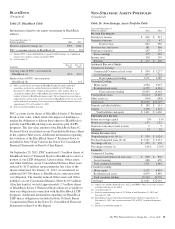
Table 24: Residential Mortgage Banking Table
Year ended December 31
Dollars in millions, except as noted 2012 2011
I
NCOME
S
TATEMENT
Net interest income $ 209 $ 201
Noninterest income
Loan servicing revenue
Servicing fees 205 226
Net MSR hedging gains 119 220
Loan sales revenue
Provision for residential mortgage
repurchase obligations (761) (102)
Loan sales revenue 747 384
Other 7 23
Total noninterest income 317 751
Total revenue 526 952
Provision for credit losses (benefit) (5) 5
Noninterest expense (a) 992 797
Pretax earnings (loss) (461) 150
Income taxes (benefit) (153) 61
Earnings (loss) $ (308) $ 89
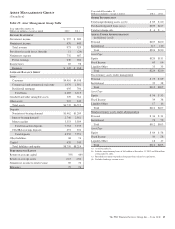
A
VERAGE
B
ALANCE
S
HEET
Portfolio loans $ 2,719 $ 2,771
Loans held for sale 1,758 1,492
Mortgage servicing rights (MSR) 632 905
Other assets 6,420 6,102
Total assets $11,529 $11,270
Deposits $ 2,560 $ 1,675
Borrowings and other liabilities 4,086 3,877
Capital 1,329 731
Total liabilities and equity $ 7,975 $ 6,283
P
ERFORMANCE
R
ATIOS
Return on average capital (23)% 12%
Return on average assets (2.67) 0.79
Noninterest income to total revenue 60 79
Efficiency 189 84
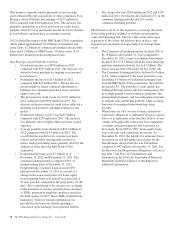
Year ended December 31
Dollars in millions, except as noted 2012 2011
R
ESIDENTIAL
M
ORTGAGE
S
ERVICING
P
ORTFOLIO
-T
HIRD
-P
ARTY
(in billions)
Beginning of period $ 118 $ 125
Acquisitions 21 6
Additions 14 12
Repayments/transfers (34) (25)
End of period $ 119 $ 118
Servicing portfolio - third-party statistics: (b)
Fixed rate 92% 90%
Adjustable rate/balloon 8% 10%
Weighted-average interest rate 4.94% 5.38%
MSR capitalized value (in billions) $ .7 $ .7
MSR capitalization value (in basis points) 54 54
Weighted-average servicing fee (in basis
points) 28 29
R
ESIDENTIAL
M
ORTGAGE
R
EPURCHASE
R
ESERVE
Beginning of period $ 83 $ 144
Provision 761 102
RBC Bank (USA) acquisition 26 –
Losses - loan repurchases and settlements (256) (163)
End of Period $ 614 $ 83
O
THER
I
NFORMATION
Loan origination volume (in billions) $15.2 $11.4
Percentage of originations represented by:
Agency and government programs 100% 100%
Refinance volume 77% 76%
Total nonperforming assets (b) (c) $ 134 $ 76
Purchased impaired loans (b) (d) $ 38 $ 112
(a) Includes a goodwill impairment charge of $45 million during the fourth quarter of
2012.
(b) As of December 31.
(c) Includes nonperforming loans of $90 million at December 31, 2012 and $31 million
at December 31, 2011.
(d) Recorded investment of purchased impaired loans related to acquisitions.
The PNC Financial Services Group, Inc. – Form 10-K 67