PNC Bank 2012 Annual Report Download - page 61
Download and view the complete annual report
Please find page 61 of the 2012 PNC Bank annual report below. You can navigate through the pages in the report by either clicking on the pages listed below, or by using the keyword search tool below to find specific information within the annual report.-
 1
1 -
2
-
3
-
4
-
5
-
6
-
7
-
8
-
9
-
10
-
11
-
12
-
13
-
14
-
15
-
16
-
17
-
18
-
19
-
20
-
21
-
22
-
23
-
24
-
25
-
26
-
27
-
28
-
29
-
30
-
31
-
32
-
33
-
34
-
35
-
36
-
37
-
38
-
39
-
40
-
41
-
42
-
43
-
44
-
45
-
46
-
47
-
48
-
49
-
50
-
 51
51 -
 52
52 -
 53
53 -
 54
54 -
 55
55 -
 56
56 -
 57
57 -
 58
58 -
 59
59 -
 60
60 -
 61
61 -
 62
62 -
 63
63 -
 64
64 -
 65
65 -
 66
66 -
 67
67 -
 68
68 -
 69
69 -
 70
70 -
 71
71 -
72
-
73
-
74
-
75
-
76
-
77
-
78
-
79
-
80
-
81
-
82
-
83
-
84
-
85
-
86
-
87
-
88
-
89
-
90
-
91
-
92
-
93
-
94
-
95
-
96
-
97
-
98
-
99
-
100
-
101
-
102
-
103
-
104
-
105
-
106
-
107
-
108
-
109
-
110
-
111
-
112
-
113
-
114
-
115
-
116
-
117
-
118
-
119
-
120
-
121
-
122
-
123
-
124
-
125
-
126
-
127
-
128
-
129
-
130
-
131
-
132
-
133
-
134
-
135
-
136
-
137
-
138
-
139
-
140
-
141
-
142
-
143
-
144
-
145
-
146
-
147
-
148
-
149
-
150
-
151
-
152
-
153
-
154
-
155
-
156
-
157
-
158
-
159
-
160
-
161
-
162
-
163
-
164
-
165
-
166
-
167
-
168
-
169
-
170
-
171
-
172
-
173
-
174
-
175
-
176
-
177
-
178
-
179
-
180
-
181
-
182
-
183
-
184
-
185
-
186
-
187
-
188
-
189
-
190
-
191
-
192
-
193
-
194
-
195
-
196
-
197
-
198
-
199
-
200
-
201
-
202
-
203
-
204
-
205
-
206
-
207
-
208
-
209
-
210
-
211
-
212
-
213
-
214
-
215
-
216
-
217
-
218
-
219
-
220
-
221
-
222
-
223
-
224
-
225
-
226
-
227
-
228
-
229
-
230
-
231
-
232
-
233
-
234
-
235
-
236
-
237
-
238
-
239
-
240
-
241
-
242
-
243
-
244
-
245
-
246
-
247
-
248
-
249
-
250
-
251
-
252
-
253
-
254
-
255
-
256
-
257
-
258
-
259
-
260
-
261
-
262
-
263
-
264
-
265
-
266
-
267
-
268
-
269
-
270
-
271
-
272
-
273
-
274
-
275
-
276
-
277
-
278
-
279
-
280
 |
 |

C
ONSOLIDATED
B
ALANCE
S
HEET
R
EVIEW
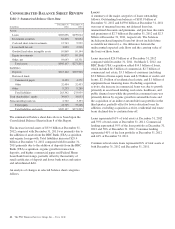
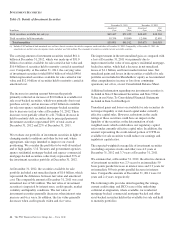
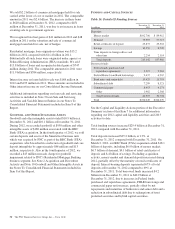
Table 3: Summarized Balance Sheet Data
In millions
December 31
2012
December 31
2011
Assets
Loans $185,856 $159,014
Investment securities 61,406 60,634
Cash and short-term investments 12,763 9,992
Loans held for sale 3,693 2,936
Goodwill and other intangible assets 10,869 10,144
Equity investments 10,877 10,134
Other, net 19,643 18,351
Total assets $305,107 $271,205
Liabilities
Deposits $213,142 $187,966
Borrowed funds
Commercial paper 8,453 4,271
Other 32,454 32,433
Other 9,293 9,289
Total liabilities 263,342 233,959
Total shareholders’ equity 39,003 34,053
Noncontrolling interests 2,762 3,193
Total equity 41,765 37,246
Total liabilities and equity $305,107 $271,205
The summarized balance sheet data above is based upon the
Consolidated Balance Sheet in Item 8 of this Report.
The increase in total assets of $33.9 billion at December 31,
2012 compared with December 31, 2011 was primarily due to
the addition of assets from the RBC Bank (USA) acquisition
and organic loan growth. Total liabilities increased $29.4
billion at December 31, 2012 compared with December 31,
2011 primarily due to the addition of deposits from the RBC
Bank (USA) acquisition, organic growth in transaction
deposits, and higher commercial paper and Federal Home
Loan Bank borrowings, partially offset by the maturity of
retail certificates of deposit and lower bank notes and senior
and subordinated debt.
An analysis of changes in selected balance sheet categories
follows.
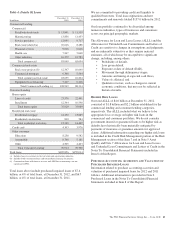
L
OANS
A summary of the major categories of loans outstanding
follows. Outstanding loan balances of $185.9 billion at
December 31, 2012 and $159.0 billion at December 31, 2011
were net of unearned income, net deferred loan fees,
unamortized discounts and premiums, and purchase discounts
and premiums of $2.7 billion at December 31, 2012 and $2.3
billion at December 31, 2011, respectively. The balances
include purchased impaired loans but do not include future
accretable net interest (i.e., the difference between the
undiscounted expected cash flows and the carrying value of
the loan) on those loans.
Loans increased $26.9 billion as of December 31, 2012
compared with December 31, 2011. On March 2, 2012, our
RBC Bank (USA) acquisition added $14.5 billion of loans,
which included $6.3 billion of commercial, $2.7 billion of
commercial real estate, $3.3 billion of consumer (including
$3.0 billion of home equity loans and $.3 billion of credit card
loans), $2.1 billion of residential real estate, and $.1 billion of
equipment lease financing loans. Excluding acquisition
activity, the increase in commercial loans was due to growth
primarily in asset-based lending, real estate, healthcare, and
public finance loans while the growth in consumer loans was
primarily driven by organic growth in automobile loans and
the acquisition of an indirect automobile loan portfolio in the
third quarter, partially offset by lower education loans. In
addition, excluding acquisition activity, residential real estate
loans declined due to continued run-off.
Loans represented 61% of total assets at December 31, 2012
and 59% of total assets at December 31, 2011. Commercial
lending represented 59% of the loan portfolio at December 31,
2012 and 56% at December 31, 2011. Consumer lending
represented 41% of the loan portfolio at December 31, 2012
and 44% at December 31, 2011.
Commercial real estate loans represented 6% of total assets at
both December 31, 2012 and December 31, 2011.
42 The PNC Financial Services Group, Inc. – Form 10-K