PNC Bank 2012 Annual Report Download - page 129
Download and view the complete annual report
Please find page 129 of the 2012 PNC Bank annual report below. You can navigate through the pages in the report by either clicking on the pages listed below, or by using the keyword search tool below to find specific information within the annual report.Investment Securities
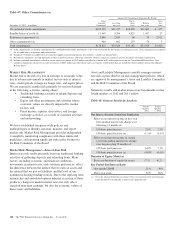
The carrying amount of investment securities totaled $60.6
billion at December 31, 2011, a decrease of $3.6 billion, or
6%, from $64.3 billion at December 31, 2010. The decline
resulted from principal payments and net sales activity related
to US Treasury and government agency and non-agency
residential mortgage-backed securities. Investment securities
represented 22% of total assets at December 31, 2011 and
24% of total assets at December 31, 2010.
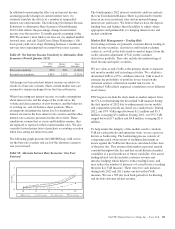
Average investment securities increased $1.7 billion, to $59.7
billion, in 2011 compared with 2010. Average securities held
to maturity increased $2.3 billion, to $9.4 billion, in 2011
compared to 2010. This increase was partially offset by the
decrease in average securities available for sale of $.6 billion,
to $50.3 billion, in 2011 compared with 2010. The increase in
average securities held to maturity was primarily a result of
transfers totaling $6.3 billion from securities available for sale
to securities held to maturity during the second and third
quarters of 2011. The transfers were completed in order to
reduce the impact of price volatility on accumulated other
comprehensive income and certain capital measures, and
considered potential changes to regulatory capital
requirements under the proposed Basel III capital standards.
At December 31, 2011, the securities available for sale
portfolio included a net unrealized loss of $41 million, which
represented the difference between fair value and amortized
cost. The comparable amount at December 31, 2010 was a net
unrealized loss of $861 million. The expected weighted-
average life of investment securities (excluding corporate
stocks and other) was 3.7 years at December 31, 2011 and 4.7
years at December 31, 2010.
Loans Held For Sale
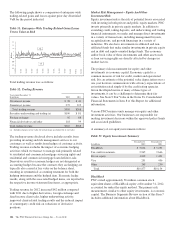
Loans held for sale totaled $2.9 billion at December 31, 2011
compared with $3.5 billion at December 31, 2010. We stopped
originating commercial mortgage loans held for sale
designated at fair value in 2008 and have pursued
opportunities to reduce these positions at appropriate prices.
At December 31, 2011, the balance relating to these loans was
$843 million, compared to $877 million at December 31,
2010. We sold $25 million in unpaid principal balances of
these commercial mortgage loans held for sale carried at fair
value in 2011 and sold $241 million in 2010.
We sold $2.4 billion of commercial mortgages held for sale
carried at the lower of cost or market to government agencies
in 2011 compared to $2.1 billion in 2010. The increase in
these loans to $451 million at December 31, 2011, compared
to $330 million at December 31, 2010, was due to an increase
in loans awaiting sales to government agencies.
Residential mortgage loan origination volume was $11.4
billion in 2011. Substantially all such loans were originated
under agency or FHA standards. We sold $11.9 billion of
loans and recognized related gains of $282 million during
2011. The comparable amounts for 2010 were $10.0 billion
and $231 million, respectively.
Asset Quality
Overall credit quality continued to improve during 2011.
Nonperforming assets declined $967 million, or 19%, to $4.2
billion as of December 31, 2011 from December 31, 2010.
Accruing loans past due increased $12 million, or less than
1%, during 2011 to $4.5 billion at year end primarily
attributable to government insured or guaranteed loans. Net
charge-offs declined significantly to $1.6 billion at
December 31, 2011, down 44% from 2010 net charge-offs of
$2.9 billion.
The ALLL was $4.3 billion, or 2.73% of total loans and 122%
of nonperforming loans, as of December 31, 2011.
At December 31, 2011, our largest nonperforming asset was
$28 million in the Accommodation and Food Services
Industry and our average nonperforming loan associated with
commercial lending was under $1 million.
Goodwill and Other Intangible Assets
Goodwill and other intangible assets totaled $10.1 billion at
December 31, 2011 and $10.8 billion at December, 31, 2010.
Goodwill increased $.1 billion, to $8.3 billion, at
December 31, 2011 compared with the December 31, 2010
balance primarily due to the BankAtlantic and Flagstar branch
acquisitions and the correction of amounts for an acquisition
affecting prior periods. The $.7 billion decline in other
intangible assets from December 31, 2010 included $.2 billion
and $.4 billion declines in commercial and residential
mortgage servicing rights, respectively.
Funding Sources
Total funding sources were $224.7 billion at December 31,
2011 and $222.9 billion at December 31, 2010.
Total deposits increased $4.6 billion, or 2%, at December 31,
2011 compared with December 31, 2010 due to an increase in
money market and demand deposits, partially offset by net
redemptions of retail certificates of deposit.
Average total deposits were $183.0 billion for 2011 compared
with $181.9 billion for 2010. Average deposits remained
essentially flat from 2010 primarily as a result of decreases of
$8.9 billion in average retail certificates of deposit and $.8
billion in average time deposits in foreign offices and other
time, which were offset by increases of $6.6 billion in average
noninterest-bearing deposits, $2.5 billion in average interest-
bearing demand deposits and $1.2 billion in average savings
deposits.
Total borrowed funds decreased $2.8 billion to $36.7 billion at
December 31, 2011 compared to December 31, 2010. The
decline from December 31, 2010 was primarily due to
maturities of federal funds purchased and repurchase
agreements, bank notes and senior debt, and subordinated debt
partially offset by issuances of FHLB borrowings and senior
notes.
110 The PNC Financial Services Group, Inc. – Form 10-K


