PNC Bank 2012 Annual Report Download - page 47
Download and view the complete annual report
Please find page 47 of the 2012 PNC Bank annual report below. You can navigate through the pages in the report by either clicking on the pages listed below, or by using the keyword search tool below to find specific information within the annual report.-
 1
1 -
2
-
3
-
4
-
5
-
6
-
7
-
8
-
9
-
10
-
11
-
12
-
13
-
14
-
15
-
16
-
17
-
18
-
19
-
20
-
21
-
22
-
23
-
24
-
25
-
26
-
27
-
28
-
29
-
30
-
31
-
32
-
33
-
34
-
35
-
36
-
 37
37 -
 38
38 -
 39
39 -
 40
40 -
 41
41 -
 42
42 -
 43
43 -
 44
44 -
 45
45 -
 46
46 -
 47
47 -
 48
48 -
 49
49 -
 50
50 -
 51
51 -
 52
52 -
 53
53 -
 54
54 -
 55
55 -
 56
56 -
 57
57 -
58
-
59
-
60
-
61
-
62
-
63
-
64
-
65
-
66
-
67
-
68
-
69
-
70
-
71
-
72
-
73
-
74
-
75
-
76
-
77
-
78
-
79
-
80
-
81
-
82
-
83
-
84
-
85
-
86
-
87
-
88
-
89
-
90
-
91
-
92
-
93
-
94
-
95
-
96
-
97
-
98
-
99
-
100
-
101
-
102
-
103
-
104
-
105
-
106
-
107
-
108
-
109
-
110
-
111
-
112
-
113
-
114
-
115
-
116
-
117
-
118
-
119
-
120
-
121
-
122
-
123
-
124
-
125
-
126
-
127
-
128
-
129
-
130
-
131
-
132
-
133
-
134
-
135
-
136
-
137
-
138
-
139
-
140
-
141
-
142
-
143
-
144
-
145
-
146
-
147
-
148
-
149
-
150
-
151
-
152
-
153
-
154
-
155
-
156
-
157
-
158
-
159
-
160
-
161
-
162
-
163
-
164
-
165
-
166
-
167
-
168
-
169
-
170
-
171
-
172
-
173
-
174
-
175
-
176
-
177
-
178
-
179
-
180
-
181
-
182
-
183
-
184
-
185
-
186
-
187
-
188
-
189
-
190
-
191
-
192
-
193
-
194
-
195
-
196
-
197
-
198
-
199
-
200
-
201
-
202
-
203
-
204
-
205
-
206
-
207
-
208
-
209
-
210
-
211
-
212
-
213
-
214
-
215
-
216
-
217
-
218
-
219
-
220
-
221
-
222
-
223
-
224
-
225
-
226
-
227
-
228
-
229
-
230
-
231
-
232
-
233
-
234
-
235
-
236
-
237
-
238
-
239
-
240
-
241
-
242
-
243
-
244
-
245
-
246
-
247
-
248
-
249
-
250
-
251
-
252
-
253
-
254
-
255
-
256
-
257
-
258
-
259
-
260
-
261
-
262
-
263
-
264
-
265
-
266
-
267
-
268
-
269
-
270
-
271
-
272
-
273
-
274
-
275
-
276
-
277
-
278
-
279
-
280
 |
 |
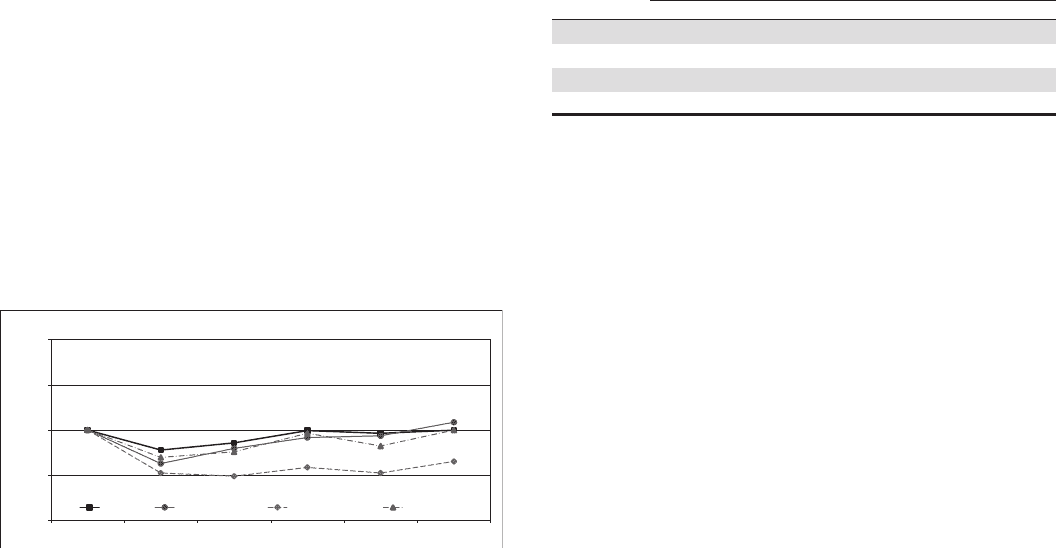
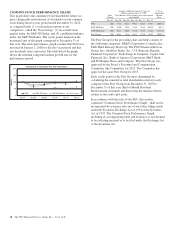
COMMON STOCK PERFORMANCE GRAPH
This graph shows the cumulative total shareholder return (i.e.,
price change plus reinvestment of dividends) on our common
stock during the five-year period ended December 31, 2012,
as compared with: (1) a selected peer group of our
competitors, called the “Peer Group;” (2) an overall stock
market index, the S&P 500 Index; and (3) a published industry
index, the S&P 500 Banks. The yearly points marked on the
horizontal axis of the graph correspond to December 31 of
that year. The stock performance graph assumes that $100 was
invested on January 1, 2008 for the five-year period and that
any dividends were reinvested. The table below the graph
shows the resultant compound annual growth rate for the
performance period.
0
50
100
150
200
Dec07 Dec08 Dec09 Dec10 Dec11 Dec12
Dollars
Comparison of Cumulative Five Year Total Return
PNC S&P 500 Index S&P 500 Banks Peer Group
Base
Period
Assumes $100 investment at Close of
Market on December 31, 2007
Total Return = Price change plus reinvestment
of dividends
5-Year
Compound
Growth
Rate
Dec. 07 Dec. 08 Dec. 09 Dec. 10 Dec. 11 Dec. 12
PNC 100 77.82 85.81 99.37 96.33 99.87 (0.03)%
S&P 500 Index 100 63.00 79.68 91.68 93.61 108.59 1.66 %
S&P 500 Banks 100 52.51 49.05 58.78 52.53 65.28 (8.18)%
Peer Group 100 69.81 75.86 96.52 82.36 99.87 (0.03)%
The Peer Group for the preceding chart and table consists of
the following companies: BB&T Corporation; Comerica Inc.;
Fifth Third Bancorp; KeyCorp; The PNC Financial Services
Group, Inc.; SunTrust Banks, Inc.; U.S. Bancorp; Regions
Financial Corporation; Wells Fargo & Company; Capital One
Financial, Inc.; Bank of America Corporation; M&T Bank;
and JP Morgan Chase and Company. This Peer Group was
approved by the Board’s Personnel and Compensation
Committee (the Committee) for 2012. The Committee has
approved the same Peer Group for 2013.
Each yearly point for the Peer Group is determined by
calculating the cumulative total shareholder return for each
company in the Peer Group from December 31, 2007 to
December 31 of that year (End of Month Dividend
Reinvestment Assumed) and then using the median of these
returns as the yearly plot point.
In accordance with the rules of the SEC, this section,
captioned “Common Stock Performance Graph,” shall not be
incorporated by reference into any of our future filings made
under the Securities Exchange Act of 1934 or the Securities
Act of 1933. The Common Stock Performance Graph,
including its accompanying table and footnotes, is not deemed
to be soliciting material or to be filed under the Exchange Act
or the Securities Act.
28 The PNC Financial Services Group, Inc. – Form 10-K