PNC Bank 2012 Annual Report Download - page 140
Download and view the complete annual report
Please find page 140 of the 2012 PNC Bank annual report below. You can navigate through the pages in the report by either clicking on the pages listed below, or by using the keyword search tool below to find specific information within the annual report.-
 1
1 -
2
-
3
-
4
-
5
-
6
-
7
-
8
-
9
-
10
-
11
-
12
-
13
-
14
-
15
-
16
-
17
-
18
-
19
-
20
-
21
-
22
-
23
-
24
-
25
-
26
-
27
-
28
-
29
-
30
-
31
-
32
-
33
-
34
-
35
-
36
-
37
-
38
-
39
-
40
-
41
-
42
-
43
-
44
-
45
-
46
-
47
-
48
-
49
-
50
-
51
-
52
-
53
-
54
-
55
-
56
-
57
-
58
-
59
-
60
-
61
-
62
-
63
-
64
-
65
-
66
-
67
-
68
-
69
-
70
-
71
-
72
-
73
-
74
-
75
-
76
-
77
-
78
-
79
-
80
-
81
-
82
-
83
-
84
-
85
-
86
-
87
-
88
-
89
-
90
-
91
-
92
-
93
-
94
-
95
-
96
-
97
-
98
-
99
-
100
-
101
-
102
-
103
-
104
-
105
-
106
-
107
-
108
-
109
-
110
-
111
-
112
-
113
-
114
-
115
-
116
-
117
-
118
-
119
-
120
-
121
-
122
-
123
-
124
-
125
-
126
-
127
-
128
-
129
-
 130
130 -
 131
131 -
 132
132 -
 133
133 -
 134
134 -
 135
135 -
 136
136 -
 137
137 -
 138
138 -
 139
139 -
 140
140 -
 141
141 -
 142
142 -
 143
143 -
 144
144 -
 145
145 -
 146
146 -
 147
147 -
 148
148 -
 149
149 -
 150
150 -
151
-
152
-
153
-
154
-
155
-
156
-
157
-
158
-
159
-
160
-
161
-
162
-
163
-
164
-
165
-
166
-
167
-
168
-
169
-
170
-
171
-
172
-
173
-
174
-
175
-
176
-
177
-
178
-
179
-
180
-
181
-
182
-
183
-
184
-
185
-
186
-
187
-
188
-
189
-
190
-
191
-
192
-
193
-
194
-
195
-
196
-
197
-
198
-
199
-
200
-
201
-
202
-
203
-
204
-
205
-
206
-
207
-
208
-
209
-
210
-
211
-
212
-
213
-
214
-
215
-
216
-
217
-
218
-
219
-
220
-
221
-
222
-
223
-
224
-
225
-
226
-
227
-
228
-
229
-
230
-
231
-
232
-
233
-
234
-
235
-
236
-
237
-
238
-
239
-
240
-
241
-
242
-
243
-
244
-
245
-
246
-
247
-
248
-
249
-
250
-
251
-
252
-
253
-
254
-
255
-
256
-
257
-
258
-
259
-
260
-
261
-
262
-
263
-
264
-
265
-
266
-
267
-
268
-
269
-
270
-
271
-
272
-
273
-
274
-
275
-
276
-
277
-
278
-
279
-
280
 |
 |

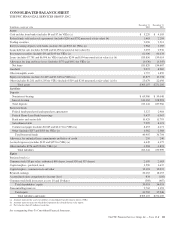
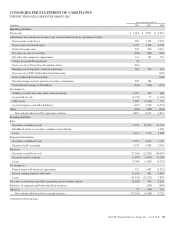
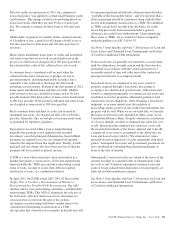
CONSOLIDATED BALANCE SHEET
THE PNC FINANCIAL SERVICES GROUP, INC.
In millions, except par value
December 31
2012
December 31
2011
Assets
Cash and due from banks (includes $4 and $7 for VIEs) (a) $ 5,220 $ 4,105
Federal funds sold and resale agreements (includes $256 and $732 measured at fair value) (b) 1,463 2,205
Trading securities 2,096 2,513
Interest-earning deposits with banks (includes $6 and $325 for VIEs) (a) 3,984 1,169
Loans held for sale (includes $2,868 and $2,258 measured at fair value) (b) 3,693 2,936
Investment securities (includes $9 and $109 for VIEs) (a) 61,406 60,634
Loans (includes $7,781 and $6,096 for VIEs) (includes $244 and $104 measured at fair value) (a) (b) 185,856 159,014
Allowance for loan and lease losses (includes $(75) and $(91) for VIEs) (a) (4,036) (4,347)
Net loans 181,820 154,667
Goodwill 9,072 8,285
Other intangible assets 1,797 1,859
Equity investments (includes $1,429 and $1,643 for VIEs) (a) 10,877 10,134
Other (includes $1,281 and $1,205 for VIEs) (includes $319 and $210 measured at fair value) (a) (b) 23,679 22,698
Total assets $305,107 $271,205
Liabilities
Deposits
Noninterest-bearing $ 69,980 $ 59,048
Interest-bearing 143,162 128,918
Total deposits 213,142 187,966
Borrowed funds
Federal funds purchased and repurchase agreements 3,327 2,984
Federal Home Loan Bank borrowings 9,437 6,967
Bank notes and senior debt 10,429 11,793
Subordinated debt 7,299 8,321
Commercial paper (includes $6,045 and $4,271 for VIEs) (a) 8,453 4,271
Other (includes $257 and $505 for VIEs) (a) 1,962 2,368
Total borrowed funds 40,907 36,704
Allowance for unfunded loan commitments and letters of credit 250 240
Accrued expenses (includes $132 and $155 for VIEs) (a) 4,449 4,175
Other (includes $976 and $734 for VIEs) (a) 4,594 4,874
Total liabilities 263,342 233,959
Equity
Preferred stock (c)
Common stock ($5 par value, authorized 800 shares, issued 538 and 537 shares) 2,690 2,683
Capital surplus – preferred stock 3,590 1,637
Capital surplus – common stock and other 12,193 12,072
Retained earnings 20,265 18,253
Accumulated other comprehensive income (loss) 834 (105)
Common stock held in treasury at cost: 10 and 10 shares (569) (487)
Total shareholders’ equity 39,003 34,053
Noncontrolling interests 2,762 3,193
Total equity 41,765 37,246
Total liabilities and equity $305,107 $271,205
(a) Amounts represent the assets or liabilities of consolidated variable interest entities (VIEs).
(b) Amounts represent items for which the Corporation has elected the fair value option.
(c) Par value less than $.5 million at each date.
See accompanying Notes To Consolidated Financial Statements.
The PNC Financial Services Group, Inc. – Form 10-K 121