PNC Bank 2012 Annual Report Download - page 205
Download and view the complete annual report
Please find page 205 of the 2012 PNC Bank annual report below. You can navigate through the pages in the report by either clicking on the pages listed below, or by using the keyword search tool below to find specific information within the annual report.-
 1
1 -
2
-
3
-
4
-
5
-
6
-
7
-
8
-
9
-
10
-
11
-
12
-
13
-
14
-
15
-
16
-
17
-
18
-
19
-
20
-
21
-
22
-
23
-
24
-
25
-
26
-
27
-
28
-
29
-
30
-
31
-
32
-
33
-
34
-
35
-
36
-
37
-
38
-
39
-
40
-
41
-
42
-
43
-
44
-
45
-
46
-
47
-
48
-
49
-
50
-
51
-
52
-
53
-
54
-
55
-
56
-
57
-
58
-
59
-
60
-
61
-
62
-
63
-
64
-
65
-
66
-
67
-
68
-
69
-
70
-
71
-
72
-
73
-
74
-
75
-
76
-
77
-
78
-
79
-
80
-
81
-
82
-
83
-
84
-
85
-
86
-
87
-
88
-
89
-
90
-
91
-
92
-
93
-
94
-
95
-
96
-
97
-
98
-
99
-
100
-
101
-
102
-
103
-
104
-
105
-
106
-
107
-
108
-
109
-
110
-
111
-
112
-
113
-
114
-
115
-
116
-
117
-
118
-
119
-
120
-
121
-
122
-
123
-
124
-
125
-
126
-
127
-
128
-
129
-
130
-
131
-
132
-
133
-
134
-
135
-
136
-
137
-
138
-
139
-
140
-
141
-
142
-
143
-
144
-
145
-
146
-
147
-
148
-
149
-
150
-
151
-
152
-
153
-
154
-
155
-
156
-
157
-
158
-
159
-
160
-
161
-
162
-
163
-
164
-
165
-
166
-
167
-
168
-
169
-
170
-
171
-
172
-
173
-
174
-
175
-
176
-
177
-
178
-
179
-
180
-
181
-
182
-
183
-
184
-
185
-
186
-
187
-
188
-
189
-
190
-
191
-
192
-
193
-
194
-
 195
195 -
 196
196 -
 197
197 -
 198
198 -
 199
199 -
 200
200 -
 201
201 -
 202
202 -
 203
203 -
 204
204 -
 205
205 -
 206
206 -
 207
207 -
 208
208 -
 209
209 -
 210
210 -
 211
211 -
 212
212 -
 213
213 -
 214
214 -
 215
215 -
216
-
217
-
218
-
219
-
220
-
221
-
222
-
223
-
224
-
225
-
226
-
227
-
228
-
229
-
230
-
231
-
232
-
233
-
234
-
235
-
236
-
237
-
238
-
239
-
240
-
241
-
242
-
243
-
244
-
245
-
246
-
247
-
248
-
249
-
250
-
251
-
252
-
253
-
254
-
255
-
256
-
257
-
258
-
259
-
260
-
261
-
262
-
263
-
264
-
265
-
266
-
267
-
268
-
269
-
270
-
271
-
272
-
273
-
274
-
275
-
276
-
277
-
278
-
279
-
280
 |
 |
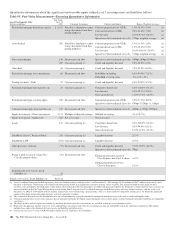
Securities
Securities include both the investment securities (comprised of
available for sale and held to maturity securities) and trading
securities portfolios. We primarily use prices obtained from
pricing services, dealer quotes or recent trades to determine
the fair value of securities. As of December 31, 2012, 86% of
the positions in these portfolios were priced by pricing
services provided by third-party vendors. The third-party
vendors use a variety of methods when pricing securities that
incorporate relevant market data to arrive at an estimate of
what a buyer in the marketplace would pay for a security
under current market conditions. One of the vendor’s prices is
set with reference to market activity for highly liquid assets,
such as U.S. Treasury and agency securities and agency
mortgage-backed securities, and matrix pricing for other asset
classes, such as commercial mortgage and other asset-backed
securities. Another vendor primarily uses pricing models
considering adjustments for ratings, spreads, matrix pricing
and prepayments for the instruments we value using this
service, such as non-agency residential mortgage-backed
securities, agency adjustable rate mortgage securities, agency
CMOs, commercial mortgage-backed securities, and
municipal bonds. Management uses various methods and
techniques to validate prices obtained from pricing services
and dealers, including reference to another third-party source,
by reviewing valuations of comparable instruments, or by
comparison to internal valuations.
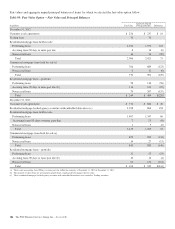
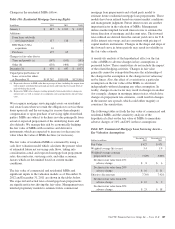
Net Loans And Loans Held For Sale
Fair values are estimated based on the discounted value of
expected net cash flows incorporating assumptions about
prepayment rates, net credit losses and servicing fees. For
purchased impaired loans, fair value is assumed to equal
PNC’s carrying value, which represents the present value of
expected future principal and interest cash flows, as adjusted
for any ALLL recorded for these loans. See Note 6 Purchased
Loans for additional information. For revolving home equity
loans and commercial credit lines, this fair value does not
include any amount for new loans or the related fees that will
be generated from the existing customer relationships.
Nonaccrual loans are valued at their estimated recovery value.
Also refer to the Fair Value Measurement and Fair Value
Option sections of this Note 9 regarding the fair value of
commercial and residential mortgage loans held for sale.
Loans are presented net of the ALLL and do not include future
accretable discounts related to purchased impaired loans.
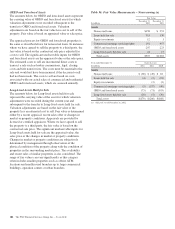
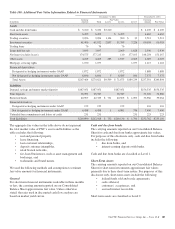
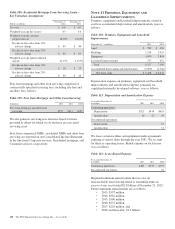
Other Assets
Other assets as shown in the preceding table includes the
following:
• FHLB and FRB stock,
• equity investments carried at cost and fair value, and
• BlackRock Series C Preferred Stock.
Investments accounted for under the equity method, including
our investment in BlackRock, are not included in the
preceding Table 100: Additional Fair Value Information
Related to Financial Instruments.
Refer to the Fair Value Measurement section of this Note 9
regarding the fair value of equity investments.
The aggregate carrying value of our investments that are
carried at cost and FHLB and FRB stock was $1.7 billion at
December 31, 2012 and was $1.9 billion at December 31,
2011, which approximates fair value at each date.
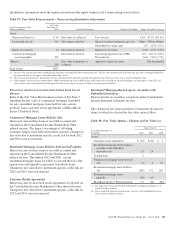
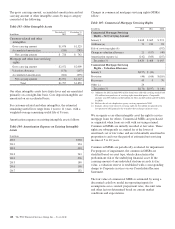
Mortgage Servicing Assets
Fair value is based on the present value of the estimated future
cash flows, incorporating assumptions as to prepayment rates,
discount rates, default rates, escrow balances, interest rates,
cost to service and other factors.
The key valuation assumptions for commercial and residential
mortgage loan servicing assets at December 31, 2012 and
December 31, 2011 are included in Note 10 Goodwill and
Other Intangible Assets.
Customer Resale Agreements
Refer to the Fair Value Measurement section of this Note 9
regarding the fair value of customer resale agreements.
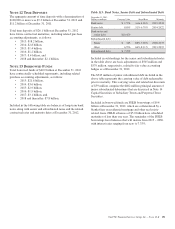
Deposits
The carrying amounts of noninterest-bearing and interest-
bearing demand, interest-bearing money market and savings
deposits approximate fair values. For time deposits, which
include foreign deposits, fair values are estimated based on the
discounted value of expected net cash flows assuming current
interest rates. All deposits are classified as Level 2.
Borrowed Funds
The carrying amounts of Federal funds purchased, commercial
paper, repurchase agreements, trading securities sold short,
cash collateral, other short-term borrowings, acceptances
outstanding and accrued interest payable are considered to be
their fair value because of their short-term nature. For all other
borrowed funds, fair values are estimated using either prices
obtained from third-party vendors or an internally developed
discounted cash flow approach taking into consideration our
current incremental borrowing rates for similar instruments.
Unfunded Loan Commitments And Letters of Credit
The fair value of unfunded loan commitments and letters of
credit is determined from a market participant’s view
including the impact of changes in interest rates, credit and
other factors. Because our obligation on substantially all
unfunded loan commitments and letters of credit varies with
changes in interest rates, these instruments are subject to little
fluctuation in fair value due to changes in interest rates. We
establish a liability on these facilities related to the
creditworthiness of our counterparty. These instruments are
classified as Level 3.
F
INANCIAL
D
ERIVATIVES
Refer to the Fair Value Measurement section of this Note 9
regarding the fair value of financial derivatives.
186 The PNC Financial Services Group, Inc. – Form 10-K