PNC Bank 2012 Annual Report Download - page 63
Download and view the complete annual report
Please find page 63 of the 2012 PNC Bank annual report below. You can navigate through the pages in the report by either clicking on the pages listed below, or by using the keyword search tool below to find specific information within the annual report.-
 1
1 -
2
-
3
-
4
-
5
-
6
-
7
-
8
-
9
-
10
-
11
-
12
-
13
-
14
-
15
-
16
-
17
-
18
-
19
-
20
-
21
-
22
-
23
-
24
-
25
-
26
-
27
-
28
-
29
-
30
-
31
-
32
-
33
-
34
-
35
-
36
-
37
-
38
-
39
-
40
-
41
-
42
-
43
-
44
-
45
-
46
-
47
-
48
-
49
-
50
-
51
-
52
-
 53
53 -
 54
54 -
 55
55 -
 56
56 -
 57
57 -
 58
58 -
 59
59 -
 60
60 -
 61
61 -
 62
62 -
 63
63 -
 64
64 -
 65
65 -
 66
66 -
 67
67 -
 68
68 -
 69
69 -
 70
70 -
 71
71 -
 72
72 -
 73
73 -
74
-
75
-
76
-
77
-
78
-
79
-
80
-
81
-
82
-
83
-
84
-
85
-
86
-
87
-
88
-
89
-
90
-
91
-
92
-
93
-
94
-
95
-
96
-
97
-
98
-
99
-
100
-
101
-
102
-
103
-
104
-
105
-
106
-
107
-
108
-
109
-
110
-
111
-
112
-
113
-
114
-
115
-
116
-
117
-
118
-
119
-
120
-
121
-
122
-
123
-
124
-
125
-
126
-
127
-
128
-
129
-
130
-
131
-
132
-
133
-
134
-
135
-
136
-
137
-
138
-
139
-
140
-
141
-
142
-
143
-
144
-
145
-
146
-
147
-
148
-
149
-
150
-
151
-
152
-
153
-
154
-
155
-
156
-
157
-
158
-
159
-
160
-
161
-
162
-
163
-
164
-
165
-
166
-
167
-
168
-
169
-
170
-
171
-
172
-
173
-
174
-
175
-
176
-
177
-
178
-
179
-
180
-
181
-
182
-
183
-
184
-
185
-
186
-
187
-
188
-
189
-
190
-
191
-
192
-
193
-
194
-
195
-
196
-
197
-
198
-
199
-
200
-
201
-
202
-
203
-
204
-
205
-
206
-
207
-
208
-
209
-
210
-
211
-
212
-
213
-
214
-
215
-
216
-
217
-
218
-
219
-
220
-
221
-
222
-
223
-
224
-
225
-
226
-
227
-
228
-
229
-
230
-
231
-
232
-
233
-
234
-
235
-
236
-
237
-
238
-
239
-
240
-
241
-
242
-
243
-
244
-
245
-
246
-
247
-
248
-
249
-
250
-
251
-
252
-
253
-
254
-
255
-
256
-
257
-
258
-
259
-
260
-
261
-
262
-
263
-
264
-
265
-
266
-
267
-
268
-
269
-
270
-
271
-
272
-
273
-
274
-
275
-
276
-
277
-
278
-
279
-
280
 |
 |

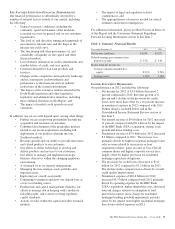
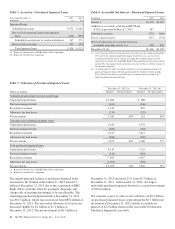
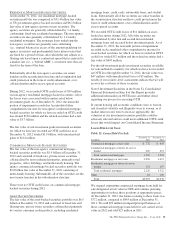
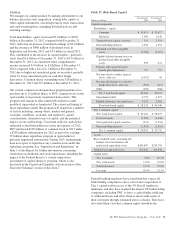
Table 5: Accretion – Purchased Impaired Loans
Year ended December 31
In millions
2012
(a)
2011
(b)
Impaired loans
Scheduled accretion $ 671 $ 666
Reversal of contractual interest on impaired
loans (404) (395)
Scheduled accretion net of contractual interest 267 271
Excess cash recoveries 157 254
Total impaired loans $ 424 $ 525
(a) Represents National City and RBC Bank (USA) acquisitions.
(b) Represents National City acquisition.
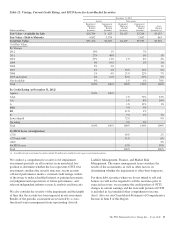
Table 6: Accretable Net Interest – Purchased Impaired Loans
In millions 2012 2011
January 1 $2,109 $2,185
Addition of accretable yield due to RBC Bank
(USA) acquisition on March 2, 2012 587
Scheduled accretion (671) (666)
Excess cash recoveries (157) (254)
Net reclassifications to accretable from non-
accretable and other activity (a) 298 844
December 31 (b) $2,166 $2,109
(a) Over 85 percent of the net reclassifications were driven by the commercial portfolio.
Over half of the commercial portfolio impact related to excess cash recoveries
recognized during the period, with the remaining due to improvements of cash
expected to be collected on both RBC Bank (USA) and National City loans in future
periods. The remaining net reclassifications were due to future cash flow changes in
the consumer portfolio.
(b) As of December 31, 2012 we estimate that the reversal of contractual interest on
purchased impaired loans will total approximately $1.2 billion in future periods.
This will offset the total net accretable interest in future interest income of $2.2
billion on purchased impaired loans.
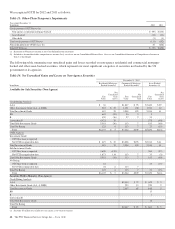
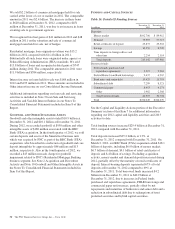
Table 7: Valuation of Purchased Impaired Loans
December 31, 2012 (a) December 31, 2011 (b)
Dollars in millions Balance Net Investment Balance Net Investment
Commercial and commercial real estate loans:
Unpaid principal balance $ 1,680 $ 988
Purchased impaired mark (431) (136)
Recorded investment 1,249 852
Allowance for loan losses (239) (229)
Net investment 1,010 60% 623 63%
Consumer and residential mortgage loans:
Unpaid principal balance 6,639 6,533
Purchased impaired mark (482) (718)
Recorded investment 6,157 5,815
Allowance for loan losses (858) (769)
Net investment 5,299 80% 5,046 77%
Total purchased impaired loans:
Unpaid principal balance 8,319 7,521
Purchased impaired mark (913) (854)
Recorded investment 7,406 6,667
Allowance for loan losses (1,097) (998)
Net investment $ 6,309 76% 5,669 75%
(a) Represents National City and RBC Bank (USA) acquisitions.
(b) Represents National City acquisition.
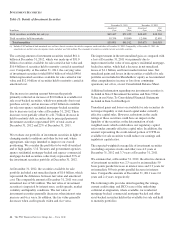
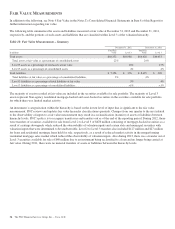
The unpaid principal balance of purchased impaired loans
increased to $8.3 billion at December 31, 2012 from $7.5
billion at December 31, 2011 due to the acquisition of RBC
Bank (USA), partially offset by payments, disposals, and
charge-offs of amounts determined to be uncollectible. The
remaining purchased impaired mark at December 31, 2012
was $913 million, which was an increase from $854 million at
December 31, 2011. The associated allowance for loan losses
increased slightly by $.1 billion to $1.1 billion at
December 31, 2012. The net investment of $6.3 billion at
December 31, 2012 increased 11% from $5.7 billion at
December 31, 2011. At December 31, 2012, our largest
individual purchased impaired loan had a recorded investment
of $18.6 million.
We currently expect to collect total cash flows of $8.5 billion
on purchased impaired loans, representing the $6.3 billion net
investment at December 31, 2012 and the accretable net
interest of $2.2 billion shown in the Accretable Net Interest-
Purchased Impaired Loans table.
44 The PNC Financial Services Group, Inc. – Form 10-K