PNC Bank 2012 Annual Report Download - page 84
Download and view the complete annual report
Please find page 84 of the 2012 PNC Bank annual report below. You can navigate through the pages in the report by either clicking on the pages listed below, or by using the keyword search tool below to find specific information within the annual report.-
 1
1 -
2
-
3
-
4
-
5
-
6
-
7
-
8
-
9
-
10
-
11
-
12
-
13
-
14
-
15
-
16
-
17
-
18
-
19
-
20
-
21
-
22
-
23
-
24
-
25
-
26
-
27
-
28
-
29
-
30
-
31
-
32
-
33
-
34
-
35
-
36
-
37
-
38
-
39
-
40
-
41
-
42
-
43
-
44
-
45
-
46
-
47
-
48
-
49
-
50
-
51
-
52
-
53
-
54
-
55
-
56
-
57
-
58
-
59
-
60
-
61
-
62
-
63
-
64
-
65
-
66
-
67
-
68
-
69
-
70
-
71
-
72
-
73
-
 74
74 -
 75
75 -
 76
76 -
 77
77 -
 78
78 -
 79
79 -
 80
80 -
 81
81 -
 82
82 -
 83
83 -
 84
84 -
 85
85 -
 86
86 -
 87
87 -
 88
88 -
 89
89 -
 90
90 -
 91
91 -
 92
92 -
 93
93 -
 94
94 -
95
-
96
-
97
-
98
-
99
-
100
-
101
-
102
-
103
-
104
-
105
-
106
-
107
-
108
-
109
-
110
-
111
-
112
-
113
-
114
-
115
-
116
-
117
-
118
-
119
-
120
-
121
-
122
-
123
-
124
-
125
-
126
-
127
-
128
-
129
-
130
-
131
-
132
-
133
-
134
-
135
-
136
-
137
-
138
-
139
-
140
-
141
-
142
-
143
-
144
-
145
-
146
-
147
-
148
-
149
-
150
-
151
-
152
-
153
-
154
-
155
-
156
-
157
-
158
-
159
-
160
-
161
-
162
-
163
-
164
-
165
-
166
-
167
-
168
-
169
-
170
-
171
-
172
-
173
-
174
-
175
-
176
-
177
-
178
-
179
-
180
-
181
-
182
-
183
-
184
-
185
-
186
-
187
-
188
-
189
-
190
-
191
-
192
-
193
-
194
-
195
-
196
-
197
-
198
-
199
-
200
-
201
-
202
-
203
-
204
-
205
-
206
-
207
-
208
-
209
-
210
-
211
-
212
-
213
-
214
-
215
-
216
-
217
-
218
-
219
-
220
-
221
-
222
-
223
-
224
-
225
-
226
-
227
-
228
-
229
-
230
-
231
-
232
-
233
-
234
-
235
-
236
-
237
-
238
-
239
-
240
-
241
-
242
-
243
-
244
-
245
-
246
-
247
-
248
-
249
-
250
-
251
-
252
-
253
-
254
-
255
-
256
-
257
-
258
-
259
-
260
-
261
-
262
-
263
-
264
-
265
-
266
-
267
-
268
-
269
-
270
-
271
-
272
-
273
-
274
-
275
-
276
-
277
-
278
-
279
-
280
 |
 |

A
SSET
M
ANAGEMENT
G
ROUP
(Unaudited)
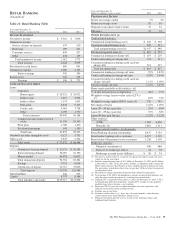
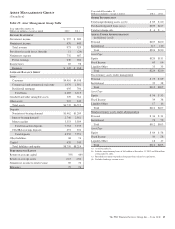
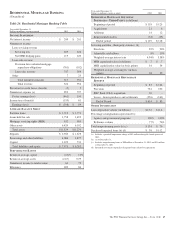
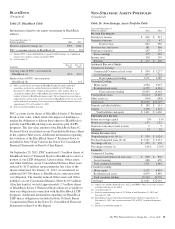
Table 23: Asset Management Group Table
Year ended December 31
Dollars in millions, except as noted 2012 2011
I
NCOME
S
TATEMENT
Net interest income $ 297 $ 280
Noninterest income 676 649
Total revenue 973 929
Provision for credit losses (benefit) 11 (24)
Noninterest expense 732 687
Pretax earnings 230 266
Income taxes 85 98
Earnings $ 145 $ 168
A
VERAGE
B
ALANCE
S
HEET
Loans
Consumer $4,416 $4,108
Commercial and commercial real estate 1,076 1,301
Residential mortgage 695 706
Total loans 6,187 6,115
Goodwill and other intangible assets 329 361
Other assets 219 243
Total assets $6,735 $6,719
Deposits
Noninterest-bearing demand $1,462 $1,209
Interest-bearing demand 2,746 2,361
Money market 3,553 3,589
Total transaction deposits 7,761 7,159
CDs/IRAs/savings deposits 491 632
Total deposits 8,252 7,791
Other liabilities 68 74
Capital 439 349
Total liabilities and equity $8,759 $8,214
P
ERFORMANCE
R
ATIOS
Return on average capital 33% 48%
Return on average assets 2.15 2.50
Noninterest income to total revenue 69 70
Efficiency 75 74
Year ended December 31
Dollars in millions, except as noted 2012 2011
O
THER
I
NFORMATION
Total nonperforming assets (a) (b) $ 69 $ 60
Purchased impaired loans (a) (c) $109 $127
Total net charge-offs $ 6 $ –
A
SSETS
U
NDER
A
DMINISTRATION
(in billions) (a) (d)
Personal $107 $100
Institutional 117 110
Total $224 $210
Asset Type
Equity $120 $111
Fixed Income 69 66
Liquidity/Other 35 33
Total $224 $210
Discretionary assets under management
Personal $ 73 $ 69
Institutional 39 38
Total $112 $107
Asset Type
Equity $ 56 $ 53
Fixed Income 39 38
Liquidity/Other 17 16
Total $112 $107
Nondiscretionary assets under administration
Personal $ 34 $ 31
Institutional 78 72
Total $112 $103
Asset Type
Equity $ 64 $ 58
Fixed Income 30 28
Liquidity/Other 18 17
Total $112 $103
(a) As of December 31.
(b) Includes nonperforming loans of $65 million at December 31, 2012 and $56 million
at December 31, 2011.
(c) Recorded investment of purchased impaired loans related to acquisitions.
(d) Excludes brokerage account assets.
The PNC Financial Services Group, Inc. – Form 10-K 65