PNC Bank 2012 Annual Report Download - page 258
Download and view the complete annual report
Please find page 258 of the 2012 PNC Bank annual report below. You can navigate through the pages in the report by either clicking on the pages listed below, or by using the keyword search tool below to find specific information within the annual report.-
 1
1 -
2
-
3
-
4
-
5
-
6
-
7
-
8
-
9
-
10
-
11
-
12
-
13
-
14
-
15
-
16
-
17
-
18
-
19
-
20
-
21
-
22
-
23
-
24
-
25
-
26
-
27
-
28
-
29
-
30
-
31
-
32
-
33
-
34
-
35
-
36
-
37
-
38
-
39
-
40
-
41
-
42
-
43
-
44
-
45
-
46
-
47
-
48
-
49
-
50
-
51
-
52
-
53
-
54
-
55
-
56
-
57
-
58
-
59
-
60
-
61
-
62
-
63
-
64
-
65
-
66
-
67
-
68
-
69
-
70
-
71
-
72
-
73
-
74
-
75
-
76
-
77
-
78
-
79
-
80
-
81
-
82
-
83
-
84
-
85
-
86
-
87
-
88
-
89
-
90
-
91
-
92
-
93
-
94
-
95
-
96
-
97
-
98
-
99
-
100
-
101
-
102
-
103
-
104
-
105
-
106
-
107
-
108
-
109
-
110
-
111
-
112
-
113
-
114
-
115
-
116
-
117
-
118
-
119
-
120
-
121
-
122
-
123
-
124
-
125
-
126
-
127
-
128
-
129
-
130
-
131
-
132
-
133
-
134
-
135
-
136
-
137
-
138
-
139
-
140
-
141
-
142
-
143
-
144
-
145
-
146
-
147
-
148
-
149
-
150
-
151
-
152
-
153
-
154
-
155
-
156
-
157
-
158
-
159
-
160
-
161
-
162
-
163
-
164
-
165
-
166
-
167
-
168
-
169
-
170
-
171
-
172
-
173
-
174
-
175
-
176
-
177
-
178
-
179
-
180
-
181
-
182
-
183
-
184
-
185
-
186
-
187
-
188
-
189
-
190
-
191
-
192
-
193
-
194
-
195
-
196
-
197
-
198
-
199
-
200
-
201
-
202
-
203
-
204
-
205
-
206
-
207
-
208
-
209
-
210
-
211
-
212
-
213
-
214
-
215
-
216
-
217
-
218
-
219
-
220
-
221
-
222
-
223
-
224
-
225
-
226
-
227
-
228
-
229
-
230
-
231
-
232
-
233
-
234
-
235
-
236
-
237
-
238
-
239
-
240
-
241
-
242
-
243
-
244
-
245
-
246
-
247
-
 248
248 -
 249
249 -
 250
250 -
 251
251 -
 252
252 -
 253
253 -
 254
254 -
 255
255 -
 256
256 -
 257
257 -
 258
258 -
 259
259 -
 260
260 -
 261
261 -
 262
262 -
 263
263 -
 264
264 -
 265
265 -
 266
266 -
 267
267 -
 268
268 -
269
-
270
-
271
-
272
-
273
-
274
-
275
-
276
-
277
-
278
-
279
-
280
 |
 |

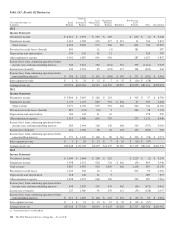
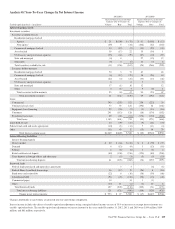
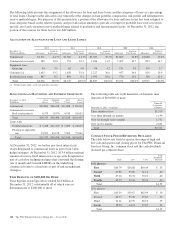
Analysis Of Year-To-Year Changes In Net Interest Income
2012/2011 2011/2010
Increase/(Decrease) in Income/
Expense Due to Changes in:
Increase/(Decrease) in Income/
Expense Due to Changes in:
Taxable-equivalent basis – in millions Volume Rate Total Volume Rate Total
Interest-Earning Assets
Investment securities
Securities available for sale
Residential mortgage-backed
Agency $ 21 $(100) $ (79) $ 91 $(108) $ (17)
Non-agency (49) 5 (44) (102) (62) (164)
Commercial mortgage-backed 10 (12) (2) (11) (22) (33)
Asset-backed 39 (17) 22 35 (34) 1
US Treasury and government agencies (35) (24) (59) (87) (10) (97)
State and municipal (4) 4 27 (15) 12
Other debt (9) 4 (5) 15 (7) 8
Total securities available for sale (11) (156) (167) (24) (266) (290)
Securities held to maturity
Residential mortgage-backed 70 3 73 83 83
Commercial mortgage-backed (8) (17) (25) 38 (24) 14
Asset-backed (22) (4) (26) (33) (13) (46)
US Treasury and government agencies 6 6 3 3
State and municipal 17 (1) 16 12 12
Other 4 (1) 3 9 (8) 1
Total securities held to maturity 55 (8) 47 90 (23) 67
Total investment securities 41 (161) (120) 69 (292) (223)
Loans
Commercial 790 (267) 523 258 (222) 36
Commercial real estate 73 53 126 (192) 26 (166)
Equipment lease financing 22 (24) (2) (3) (13) (16)
Consumer 241 (113) 128 (18) (174) (192)
Residential real estate 29 (80) (51) (176) (150) (326)
Total loans 1,185 (461) 724 (93) (571) (664)
Loans held for sale 14 (39) (25) (9) (61) (70)
Federal funds sold and resale agreements (10) (1) (11) 7 (11) (4)
Other (31) 43 12 (15) 44 29
Total interest-earning assets $1,069 $(489) $ 580 $ (20) $(912) $(932)
Interest-Bearing Liabilities
Interest-bearing deposits
Money market $ 20 $ (66) $ (46) $ 2 $ (79) $ (77)
Demand 4 (13) (9) 3 (13) (10)
Savings 2 (8) (6) 3 (1) 2
Retail certificates of deposit (80) (138) (218) (120) (80) (200)
Time deposits in foreign offices and other time 2 (5) (3) (5) (5) (10)
Total interest-bearing deposits 41 (323) (282) (38) (257) (295)
Borrowed funds
Federal funds purchased and repurchase agreements 3 3 (6) (6)
Federal Home Loan Bank borrowings 36 (17) 19 (26) 8 (18)
Bank notes and senior debt (22) 6 (16) (38) (30) (68)
Subordinated debt (91) (45) (136) (36) (13) (49)
Commercial paper 14 14 1 (1)
Other (13) 11 (2) (2) 10 8
Total borrowed funds 127 (245) (118) (102) (31) (133)
Total interest-bearing liabilities 121 (521) (400) (100) (328) (428)
Change in net interest income $ 953 $ 27 $ 980 $ (17) $(487) $(504)
Changes attributable to rate/volume are prorated into rate and volume components.
Interest income includes the effects of taxable-equivalent adjustments using a marginal federal income tax rate of 35% to increase tax-exempt interest income to a
taxable- equivalent basis. The taxable-equivalent adjustments to interest income for the years ended December 31, 2012, 2011, and 2010 were $144 million, $104
million, and $81 million, respectively.
The PNC Financial Services Group, Inc. – Form 10-K 239