PNC Bank 2012 Annual Report Download - page 141
Download and view the complete annual report
Please find page 141 of the 2012 PNC Bank annual report below. You can navigate through the pages in the report by either clicking on the pages listed below, or by using the keyword search tool below to find specific information within the annual report.-
 1
1 -
2
-
3
-
4
-
5
-
6
-
7
-
8
-
9
-
10
-
11
-
12
-
13
-
14
-
15
-
16
-
17
-
18
-
19
-
20
-
21
-
22
-
23
-
24
-
25
-
26
-
27
-
28
-
29
-
30
-
31
-
32
-
33
-
34
-
35
-
36
-
37
-
38
-
39
-
40
-
41
-
42
-
43
-
44
-
45
-
46
-
47
-
48
-
49
-
50
-
51
-
52
-
53
-
54
-
55
-
56
-
57
-
58
-
59
-
60
-
61
-
62
-
63
-
64
-
65
-
66
-
67
-
68
-
69
-
70
-
71
-
72
-
73
-
74
-
75
-
76
-
77
-
78
-
79
-
80
-
81
-
82
-
83
-
84
-
85
-
86
-
87
-
88
-
89
-
90
-
91
-
92
-
93
-
94
-
95
-
96
-
97
-
98
-
99
-
100
-
101
-
102
-
103
-
104
-
105
-
106
-
107
-
108
-
109
-
110
-
111
-
112
-
113
-
114
-
115
-
116
-
117
-
118
-
119
-
120
-
121
-
122
-
123
-
124
-
125
-
126
-
127
-
128
-
129
-
130
-
 131
131 -
 132
132 -
 133
133 -
 134
134 -
 135
135 -
 136
136 -
 137
137 -
 138
138 -
 139
139 -
 140
140 -
 141
141 -
 142
142 -
 143
143 -
 144
144 -
 145
145 -
 146
146 -
 147
147 -
 148
148 -
 149
149 -
 150
150 -
 151
151 -
152
-
153
-
154
-
155
-
156
-
157
-
158
-
159
-
160
-
161
-
162
-
163
-
164
-
165
-
166
-
167
-
168
-
169
-
170
-
171
-
172
-
173
-
174
-
175
-
176
-
177
-
178
-
179
-
180
-
181
-
182
-
183
-
184
-
185
-
186
-
187
-
188
-
189
-
190
-
191
-
192
-
193
-
194
-
195
-
196
-
197
-
198
-
199
-
200
-
201
-
202
-
203
-
204
-
205
-
206
-
207
-
208
-
209
-
210
-
211
-
212
-
213
-
214
-
215
-
216
-
217
-
218
-
219
-
220
-
221
-
222
-
223
-
224
-
225
-
226
-
227
-
228
-
229
-
230
-
231
-
232
-
233
-
234
-
235
-
236
-
237
-
238
-
239
-
240
-
241
-
242
-
243
-
244
-
245
-
246
-
247
-
248
-
249
-
250
-
251
-
252
-
253
-
254
-
255
-
256
-
257
-
258
-
259
-
260
-
261
-
262
-
263
-
264
-
265
-
266
-
267
-
268
-
269
-
270
-
271
-
272
-
273
-
274
-
275
-
276
-
277
-
278
-
279
-
280
 |
 |

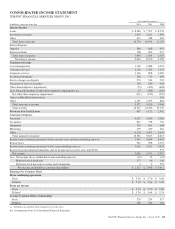
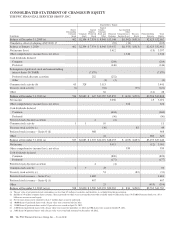
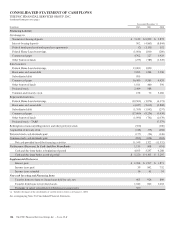
CONSOLIDATED STATEMENT OF CHANGES IN EQUITY
THE PNC FINANCIAL SERVICES GROUP, INC.
Shareholders’ Equity
In millions
Shares
Outstanding
Common
Stock
Common
Stock
Capital
Surplus -
Preferred
Stock
Capital
Surplus -
Common
Stock and
Other
Retained
Earnings
Accumulated
Other
Comprehensive
Income (Loss)
Treasury
Stock
Noncontrolling
Interests
Total
Equity
Balance at December 31, 2009 (a) 462 $2,354 $ 7,974 $ 8,945 $13,144 $(1,962) $(513) $2,625 $32,567
Cumulative effect of adopting ASU 2009-17 (92) (13) (105)
Balance at January 1, 2010 462 $2,354 $ 7,974 $ 8,945 $13,052 $(1,975) $(513) $2,625 $32,462
Net income (loss) 3,412 (15) 3,397
Other comprehensive income (loss), net of tax 1,544 1,544
Cash dividends declared
Common (204) (204)
Preferred (146) (146)
Redemption of preferred stock and noncontrolling
interest Series N (TARP) (7,579) (7,579)
Preferred stock discount accretion 252 (252)
Other (1) (3) (4)
Common stock activity (b) 65 328 3,113 3,441
Treasury stock activity (1) (62) (59) (121)
Other 62 (14) 48
Balance at December 31, 2010 (a) 526 $2,682 $ 647 $12,057 $15,859 $ (431) $(572) $2,596 $32,838
Net income 3,056 15 3,071
Other comprehensive income (loss), net of tax 326 326
Cash dividends declared
Common (604) (604)
Preferred (56) (56)
Preferred stock discount accretion 2 (2)
Common stock activity 1 1 10 11
Treasury stock activity (c) (36) 85 49
Preferred stock issuance – Series O (d) 988 988
Other 41 582 623
Balance at December 31, 2011 (a) 527 $2,683 $ 1,637 $12,072 $18,253 $ (105) $(487) $3,193 $37,246
Net income 3,013 (12) 3,001
Other comprehensive income (loss), net of tax 939 939
Cash dividends declared
Common (820) (820)
Preferred (177) (177)
Preferred stock discount accretion 4 (4)
Common stock activity 1 7 45 52
Treasury stock activity (c) 51 (82) (31)
Preferred stock issuance – Series P (e) 1,482 1,482
Preferred stock issuance – Series Q (f) 467 467
Other 25 (419) (394)
Balance at December 31, 2012 (a) (g) 528 $2,690 $ 3,590 $12,193 $20,265 $ 834 $(569) $2,762 $41,765
(a) The par value of our preferred stock outstanding was less than $.5 million at each date and, therefore, is excluded from this presentation.
(b) Includes 63.9 million common shares issuance, the net proceeds of which were used together with other available funds to redeem the Series N (TARP) Preferred Stock, for a $3.4
billion net increase in total equity.
(c) Net treasury stock activity totaled less than .5 million shares issued or redeemed.
(d) 10,000 Series O preferred shares with a $1 par value were issued on July 20, 2011.
(e) 15,000 Series P preferred shares with a $1 par value were issued on April 24, 2012.
(f) 4,500 Series Q preferred shares with a $1 par value were issued on September 21, 2012 and 300 shares were issued on October 9, 2012.
(g) 5,001 Series M preferred shares with a $1 par value were issued and redeemed on December 10, 2012.
122 The PNC Financial Services Group, Inc. – Form 10-K