PNC Bank 2012 Annual Report Download - page 65
Download and view the complete annual report
Please find page 65 of the 2012 PNC Bank annual report below. You can navigate through the pages in the report by either clicking on the pages listed below, or by using the keyword search tool below to find specific information within the annual report.-
 1
1 -
2
-
3
-
4
-
5
-
6
-
7
-
8
-
9
-
10
-
11
-
12
-
13
-
14
-
15
-
16
-
17
-
18
-
19
-
20
-
21
-
22
-
23
-
24
-
25
-
26
-
27
-
28
-
29
-
30
-
31
-
32
-
33
-
34
-
35
-
36
-
37
-
38
-
39
-
40
-
41
-
42
-
43
-
44
-
45
-
46
-
47
-
48
-
49
-
50
-
51
-
52
-
53
-
54
-
 55
55 -
 56
56 -
 57
57 -
 58
58 -
 59
59 -
 60
60 -
 61
61 -
 62
62 -
 63
63 -
 64
64 -
 65
65 -
 66
66 -
 67
67 -
 68
68 -
 69
69 -
 70
70 -
 71
71 -
 72
72 -
 73
73 -
 74
74 -
 75
75 -
76
-
77
-
78
-
79
-
80
-
81
-
82
-
83
-
84
-
85
-
86
-
87
-
88
-
89
-
90
-
91
-
92
-
93
-
94
-
95
-
96
-
97
-
98
-
99
-
100
-
101
-
102
-
103
-
104
-
105
-
106
-
107
-
108
-
109
-
110
-
111
-
112
-
113
-
114
-
115
-
116
-
117
-
118
-
119
-
120
-
121
-
122
-
123
-
124
-
125
-
126
-
127
-
128
-
129
-
130
-
131
-
132
-
133
-
134
-
135
-
136
-
137
-
138
-
139
-
140
-
141
-
142
-
143
-
144
-
145
-
146
-
147
-
148
-
149
-
150
-
151
-
152
-
153
-
154
-
155
-
156
-
157
-
158
-
159
-
160
-
161
-
162
-
163
-
164
-
165
-
166
-
167
-
168
-
169
-
170
-
171
-
172
-
173
-
174
-
175
-
176
-
177
-
178
-
179
-
180
-
181
-
182
-
183
-
184
-
185
-
186
-
187
-
188
-
189
-
190
-
191
-
192
-
193
-
194
-
195
-
196
-
197
-
198
-
199
-
200
-
201
-
202
-
203
-
204
-
205
-
206
-
207
-
208
-
209
-
210
-
211
-
212
-
213
-
214
-
215
-
216
-
217
-
218
-
219
-
220
-
221
-
222
-
223
-
224
-
225
-
226
-
227
-
228
-
229
-
230
-
231
-
232
-
233
-
234
-
235
-
236
-
237
-
238
-
239
-
240
-
241
-
242
-
243
-
244
-
245
-
246
-
247
-
248
-
249
-
250
-
251
-
252
-
253
-
254
-
255
-
256
-
257
-
258
-
259
-
260
-
261
-
262
-
263
-
264
-
265
-
266
-
267
-
268
-
269
-
270
-
271
-
272
-
273
-
274
-
275
-
276
-
277
-
278
-
279
-
280
 |
 |

I
NVESTMENT
S
ECURITIES
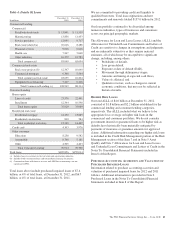
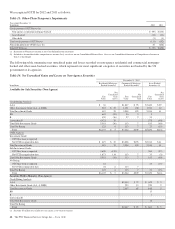
Table 11: Details of Investment Securities
December 31, 2012 December 31, 2011
In millions
Amortized
Cost
Fair
Value
Amortized
Cost
Fair
Value
Total securities available for sale (a) $49,447 $51,052 $48,609 $48,568
Total securities held to maturity 10,354 10,860 12,066 12,450
Total securities $59,801 $61,912 $60,675 $61,018
(a) Includes $367 million of both amortized cost and fair value of securities classified as corporate stocks and other at December 31, 2012. Comparably, at December 31, 2011, the
amortized cost and fair value of corporate stocks and other was $368 million. The remainder of securities available for sale were debt securities.
The carrying amount of investment securities totaled $61.4
billion at December 31, 2012, which was made up of $51.0
billion of securities available for sale carried at fair value and
$10.4 billion of securities held to maturity carried at amortized
cost. Comparably, at December 31, 2011, the carrying value
of investment securities totaled $60.6 billion of which $48.6
billion represented securities available for sale carried at fair
value and $12.0 billion of securities held to maturity carried at
amortized cost.
The increase in carrying amount between the periods
primarily reflected an increase of $2.0 billion in available for
sale asset-backed securities, which was primarily due to net
purchase activity, and an increase of $.6 billion in available
for sale non-agency residential mortgage-backed securities
due to increases in fair value at December 31, 2012. These
increases were partially offset by a $1.7 billion decrease in
held to maturity debt securities due to principal payments.
Investment securities represented 20% of total assets at
December 31, 2012 and 22% at December 31, 2011.
We evaluate our portfolio of investment securities in light of
changing market conditions and other factors and, where
appropriate, take steps intended to improve our overall
positioning. We consider the portfolio to be well-diversified
and of high quality. U.S. Treasury and government agencies,
agency residential mortgage-backed and agency commercial
mortgage-backed securities collectively represented 59% of
the investment securities portfolio at December 31, 2012.
At December 31, 2012, the securities available for sale
portfolio included a net unrealized gain of $1.6 billion, which
represented the difference between fair value and amortized
cost. The comparable amount at December 31, 2011 was a net
unrealized loss of $41 million. The fair value of investment
securities is impacted by interest rates, credit spreads, market
volatility and liquidity conditions. The fair value of
investment securities generally decreases when interest rates
increase and vice versa. In addition, the fair value generally
decreases when credit spreads widen and vice versa.
The improvement in the net unrealized gain as compared with
a loss at December 31, 2011 was primarily due to
improvement in the value of non-agency residential mortgage-
backed securities, which had a decrease in net unrealized
losses of $1.1 billion, and lower market interest rates. Net
unrealized gains and losses in the securities available for sale
portfolio are included in Shareholders’ equity as Accumulated
other comprehensive income or loss from continuing
operations, net of tax, on our Consolidated Balance Sheet.
Additional information regarding our investment securities is
included in Note 8 Investment Securities and Note 9 Fair
Value in our Notes To Consolidated Financial Statements
included in Item 8 of this Report.
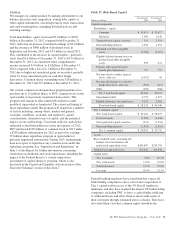
Unrealized gains and losses on available for sale securities do
not impact liquidity or risk-based capital under currently
effective capital rules. However, reductions in the credit
ratings of these securities could have an impact on the
liquidity of the securities or the determination of risk-
weighted assets which could reduce our regulatory capital
ratios under currently effective capital rules. In addition, the
amount representing the credit-related portion of OTTI on
available for sale securities would reduce our earnings and
regulatory capital ratios.
The expected weighted-average life of investment securities
(excluding corporate stocks and other) was 4.0 years at
December 31, 2012 and 3.7 years at December 31, 2011.
We estimate that, at December 31, 2012, the effective duration
of investment securities was 2.3 years for an immediate 50
basis points parallel increase in interest rates and 2.2 years for
an immediate 50 basis points parallel decrease in interest
rates. Comparable amounts at December 31, 2011 were 2.6
years and 2.4 years, respectively.
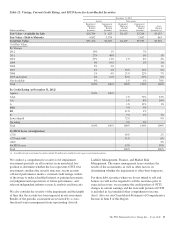
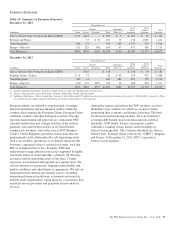
The following table provides detail regarding the vintage,
current credit rating, and FICO score of the underlying
collateral at origination, where available, for residential
mortgage-backed, commercial mortgage-backed and other
asset-backed securities held in the available for sale and held
to maturity portfolios:
46 The PNC Financial Services Group, Inc. – Form 10-K