PNC Bank 2012 Annual Report Download - page 106
Download and view the complete annual report
Please find page 106 of the 2012 PNC Bank annual report below. You can navigate through the pages in the report by either clicking on the pages listed below, or by using the keyword search tool below to find specific information within the annual report.-
 1
1 -
2
-
3
-
4
-
5
-
6
-
7
-
8
-
9
-
10
-
11
-
12
-
13
-
14
-
15
-
16
-
17
-
18
-
19
-
20
-
21
-
22
-
23
-
24
-
25
-
26
-
27
-
28
-
29
-
30
-
31
-
32
-
33
-
34
-
35
-
36
-
37
-
38
-
39
-
40
-
41
-
42
-
43
-
44
-
45
-
46
-
47
-
48
-
49
-
50
-
51
-
52
-
53
-
54
-
55
-
56
-
57
-
58
-
59
-
60
-
61
-
62
-
63
-
64
-
65
-
66
-
67
-
68
-
69
-
70
-
71
-
72
-
73
-
74
-
75
-
76
-
77
-
78
-
79
-
80
-
81
-
82
-
83
-
84
-
85
-
86
-
87
-
88
-
89
-
90
-
91
-
92
-
93
-
94
-
95
-
 96
96 -
 97
97 -
 98
98 -
 99
99 -
 100
100 -
 101
101 -
 102
102 -
 103
103 -
 104
104 -
 105
105 -
 106
106 -
 107
107 -
 108
108 -
 109
109 -
 110
110 -
 111
111 -
 112
112 -
 113
113 -
 114
114 -
 115
115 -
 116
116 -
117
-
118
-
119
-
120
-
121
-
122
-
123
-
124
-
125
-
126
-
127
-
128
-
129
-
130
-
131
-
132
-
133
-
134
-
135
-
136
-
137
-
138
-
139
-
140
-
141
-
142
-
143
-
144
-
145
-
146
-
147
-
148
-
149
-
150
-
151
-
152
-
153
-
154
-
155
-
156
-
157
-
158
-
159
-
160
-
161
-
162
-
163
-
164
-
165
-
166
-
167
-
168
-
169
-
170
-
171
-
172
-
173
-
174
-
175
-
176
-
177
-
178
-
179
-
180
-
181
-
182
-
183
-
184
-
185
-
186
-
187
-
188
-
189
-
190
-
191
-
192
-
193
-
194
-
195
-
196
-
197
-
198
-
199
-
200
-
201
-
202
-
203
-
204
-
205
-
206
-
207
-
208
-
209
-
210
-
211
-
212
-
213
-
214
-
215
-
216
-
217
-
218
-
219
-
220
-
221
-
222
-
223
-
224
-
225
-
226
-
227
-
228
-
229
-
230
-
231
-
232
-
233
-
234
-
235
-
236
-
237
-
238
-
239
-
240
-
241
-
242
-
243
-
244
-
245
-
246
-
247
-
248
-
249
-
250
-
251
-
252
-
253
-
254
-
255
-
256
-
257
-
258
-
259
-
260
-
261
-
262
-
263
-
264
-
265
-
266
-
267
-
268
-
269
-
270
-
271
-
272
-
273
-
274
-
275
-
276
-
277
-
278
-
279
-
280
 |
 |

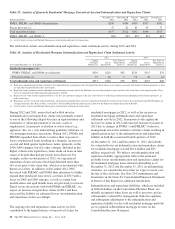
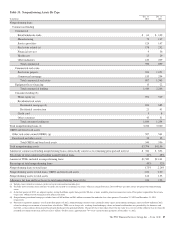
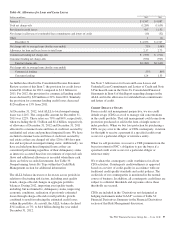
Table 33: Nonperforming Assets By Type
In millions
Dec. 31
2012
Dec. 31
2011
Nonperforming loans
Commercial lending
Commercial
Retail/wholesale trade $ 61 $ 109
Manufacturing 73 117
Service providers 124 147
Real estate related (a) 178 252
Financial services 936
Health care 25 29
Other industries 120 209
Total commercial 590 899
Commercial real estate
Real estate projects 654 1,051
Commercial mortgage 153 294
Total commercial real estate 807 1,345
Equipment lease financing 13 22
Total commercial lending 1,410 2,266
Consumer lending (b)
Home equity (c) 951 529
Residential real estate
Residential mortgage (d) 824 685
Residential construction 21 41
Credit card 58
Other consumer 43 31
Total consumer lending (e) 1,844 1,294
Total nonperforming loans (f) 3,254 3,560
OREO and foreclosed assets
Other real estate owned (OREO) (g) 507 561
Foreclosed and other assets 33 35
Total OREO and foreclosed assets 540 596
Total nonperforming assets $3,794 $4,156
Amount of commercial lending nonperforming loans contractually current as to remaining principal and interest $ 342 $ 632
Percentage of total commercial lending nonperforming loans 24% 28%
Amount of TDRs included in nonperforming loans $1,589 $1,141
Percentage of total nonperforming loans 49% 32%
Nonperforming loans to total loans 1.75% 2.24%
Nonperforming assets to total loans, OREO and foreclosed assets 2.04 2.60
Nonperforming assets to total assets 1.24 1.53
Allowance for loan and lease losses to total nonperforming loans (f) (h) 124 122
(a) Includes loans related to customers in the real estate and construction industries.
(b) Excludes most consumer loans and lines of credit, not secured by residential real estate, which are charged off after 120 to 180 days past due and are not placed on nonperforming
status.
(c) In the first quarter of 2012, we adopted a policy stating that Home equity loans past due 90 days or more would be placed on nonaccrual status. Prior policy required that these loans
be past due 180 days before being placed on nonaccrual status.
(d) Nonperforming residential mortgage excludes loans of $69 million and $61 million accounted for under the fair value option as December 31, 2012 and December 31, 2011,
respectively.
(e) Pursuant to regulatory guidance issued in the third quarter of 2012, nonperforming consumer loans, primarily home equity and residential mortgage, increased $288 million in 2012
related to changes in treatment of certain loans classified as TDRs, net of charge-offs, resulting from bankruptcy where no formal reaffirmation was provided by the borrower and
therefore a concession has been granted based upon discharge from personal liability. Charge-offs have been taken where the fair value less costs to sell the collateral was less than the
recorded investment of the loan and were $128.1 million. Of these loans, approximately 78% were current on their payments at December 31, 2012.
The PNC Financial Services Group, Inc. – Form 10-K 87