PNC Bank 2012 Annual Report Download - page 67
Download and view the complete annual report
Please find page 67 of the 2012 PNC Bank annual report below. You can navigate through the pages in the report by either clicking on the pages listed below, or by using the keyword search tool below to find specific information within the annual report.-
 1
1 -
2
-
3
-
4
-
5
-
6
-
7
-
8
-
9
-
10
-
11
-
12
-
13
-
14
-
15
-
16
-
17
-
18
-
19
-
20
-
21
-
22
-
23
-
24
-
25
-
26
-
27
-
28
-
29
-
30
-
31
-
32
-
33
-
34
-
35
-
36
-
37
-
38
-
39
-
40
-
41
-
42
-
43
-
44
-
45
-
46
-
47
-
48
-
49
-
50
-
51
-
52
-
53
-
54
-
55
-
56
-
 57
57 -
 58
58 -
 59
59 -
 60
60 -
 61
61 -
 62
62 -
 63
63 -
 64
64 -
 65
65 -
 66
66 -
 67
67 -
 68
68 -
 69
69 -
 70
70 -
 71
71 -
 72
72 -
 73
73 -
 74
74 -
 75
75 -
 76
76 -
 77
77 -
78
-
79
-
80
-
81
-
82
-
83
-
84
-
85
-
86
-
87
-
88
-
89
-
90
-
91
-
92
-
93
-
94
-
95
-
96
-
97
-
98
-
99
-
100
-
101
-
102
-
103
-
104
-
105
-
106
-
107
-
108
-
109
-
110
-
111
-
112
-
113
-
114
-
115
-
116
-
117
-
118
-
119
-
120
-
121
-
122
-
123
-
124
-
125
-
126
-
127
-
128
-
129
-
130
-
131
-
132
-
133
-
134
-
135
-
136
-
137
-
138
-
139
-
140
-
141
-
142
-
143
-
144
-
145
-
146
-
147
-
148
-
149
-
150
-
151
-
152
-
153
-
154
-
155
-
156
-
157
-
158
-
159
-
160
-
161
-
162
-
163
-
164
-
165
-
166
-
167
-
168
-
169
-
170
-
171
-
172
-
173
-
174
-
175
-
176
-
177
-
178
-
179
-
180
-
181
-
182
-
183
-
184
-
185
-
186
-
187
-
188
-
189
-
190
-
191
-
192
-
193
-
194
-
195
-
196
-
197
-
198
-
199
-
200
-
201
-
202
-
203
-
204
-
205
-
206
-
207
-
208
-
209
-
210
-
211
-
212
-
213
-
214
-
215
-
216
-
217
-
218
-
219
-
220
-
221
-
222
-
223
-
224
-
225
-
226
-
227
-
228
-
229
-
230
-
231
-
232
-
233
-
234
-
235
-
236
-
237
-
238
-
239
-
240
-
241
-
242
-
243
-
244
-
245
-
246
-
247
-
248
-
249
-
250
-
251
-
252
-
253
-
254
-
255
-
256
-
257
-
258
-
259
-
260
-
261
-
262
-
263
-
264
-
265
-
266
-
267
-
268
-
269
-
270
-
271
-
272
-
273
-
274
-
275
-
276
-
277
-
278
-
279
-
280
 |
 |

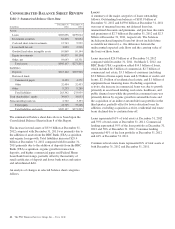
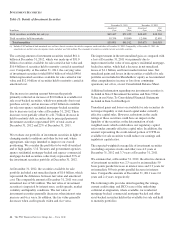
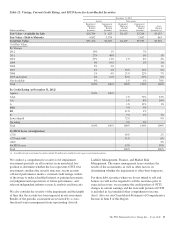
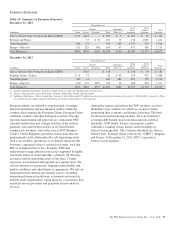
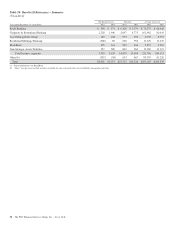
We recognized OTTI for 2012 and 2011 as follows:
Table 13: Other-Than-Temporary Impairments
Year ended December 31
In millions 2012 2011
Credit portion of OTTI losses (a)
Non-agency residential mortgage-backed $ (99) $(130)
Asset-backed (11) (21)
Other debt (1) (1)
Total credit portion of OTTI losses (111) (152)
Noncredit portion of OTTI losses (b) 32 (268)
Total OTTI losses $ (79) $(420)
(a) Reduction of Noninterest income in our Consolidated Income Statement.
(b) Included in Accumulated other comprehensive income (loss), net of tax, on our Consolidated Balance Sheet. Also see our Consolidated Statement of Comprehensive Income in
Item 8 of this Report.
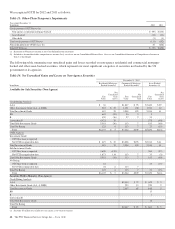
The following table summarizes net unrealized gains and losses recorded on non-agency residential and commercial mortgage-
backed and other asset-backed securities, which represent our most significant categories of securities not backed by the US
government or its agencies.
Table 14: Net Unrealized Gains and Losses on Non-Agency Securities
December 31, 2012
In millions
Residential Mortgage-
Backed Securities
Commercial Mortgage-
Backed Securities
Asset-Backed
Securities (a)
Available for Sale Securities (Non-Agency)
Fair
Value
Net
Unrealized
Gain
(Loss)
Fair
Value
Net
Unrealized
Gain
Fair
Value
Net
Unrealized
Gain
(Loss)
Credit Rating Analysis
AAA $ 36 $1,847 $ 95 $3,460 $ 29
Other Investment Grade (AA, A, BBB) 383 $ 35 1,191 100 1,554 12
Total Investment Grade 419 35 3,038 195 5,014 41
BB 683 (59) 56 5 5
B 459 (16) 57 2 33
Lower than B 4,421 39 575 (40)
Total Sub-Investment Grade 5,563 (36) 113 7 613 (40)
Total No Rating 125 6 113 7 23 (15)
Total $6,107 $ 5 $3,264 $209 $5,650 $(14)
OTTI Analysis
Investment Grade:
OTTI has been recognized
No OTTI recognized to date $ 419 $ 35 $3,038 $195 $5,014 $ 41
Total Investment Grade 419 35 3,038 195 5,014 41
Sub-Investment Grade:
OTTI has been recognized 3,690 (150) 580 (37)
No OTTI recognized to date 1,873 114 113 7 33 (3)
Total Sub-Investment Grade 5,563 (36) 113 7 613 (40)
No Rating:
OTTI has been recognized 81 23 (15)
No OTTI recognized to date 44 6 113 7
Total No Rating 125 6 113 7 23 (15)
Total $6,107 $ 5 $3,264 $209 $5,650 $(14)
Securities Held to Maturity (Non-Agency)
Credit Rating Analysis
AAA $2,444 $ 72 $ 629 $ 3
Other Investment Grade (AA, A, BBB) 223 13 220 2
Total Investment Grade 2,667 85 849 5
BB 13
B 1
Lower than B
Total Sub-Investment Grade 14
Total No Rating
Total $2,667 $ 85 $ 863 $ 5
(a) Excludes $3 million of available for sale agency asset-backed securities.
48 The PNC Financial Services Group, Inc. – Form 10-K