PNC Bank 2012 Annual Report Download - page 236
Download and view the complete annual report
Please find page 236 of the 2012 PNC Bank annual report below. You can navigate through the pages in the report by either clicking on the pages listed below, or by using the keyword search tool below to find specific information within the annual report.-
 1
1 -
2
-
3
-
4
-
5
-
6
-
7
-
8
-
9
-
10
-
11
-
12
-
13
-
14
-
15
-
16
-
17
-
18
-
19
-
20
-
21
-
22
-
23
-
24
-
25
-
26
-
27
-
28
-
29
-
30
-
31
-
32
-
33
-
34
-
35
-
36
-
37
-
38
-
39
-
40
-
41
-
42
-
43
-
44
-
45
-
46
-
47
-
48
-
49
-
50
-
51
-
52
-
53
-
54
-
55
-
56
-
57
-
58
-
59
-
60
-
61
-
62
-
63
-
64
-
65
-
66
-
67
-
68
-
69
-
70
-
71
-
72
-
73
-
74
-
75
-
76
-
77
-
78
-
79
-
80
-
81
-
82
-
83
-
84
-
85
-
86
-
87
-
88
-
89
-
90
-
91
-
92
-
93
-
94
-
95
-
96
-
97
-
98
-
99
-
100
-
101
-
102
-
103
-
104
-
105
-
106
-
107
-
108
-
109
-
110
-
111
-
112
-
113
-
114
-
115
-
116
-
117
-
118
-
119
-
120
-
121
-
122
-
123
-
124
-
125
-
126
-
127
-
128
-
129
-
130
-
131
-
132
-
133
-
134
-
135
-
136
-
137
-
138
-
139
-
140
-
141
-
142
-
143
-
144
-
145
-
146
-
147
-
148
-
149
-
150
-
151
-
152
-
153
-
154
-
155
-
156
-
157
-
158
-
159
-
160
-
161
-
162
-
163
-
164
-
165
-
166
-
167
-
168
-
169
-
170
-
171
-
172
-
173
-
174
-
175
-
176
-
177
-
178
-
179
-
180
-
181
-
182
-
183
-
184
-
185
-
186
-
187
-
188
-
189
-
190
-
191
-
192
-
193
-
194
-
195
-
196
-
197
-
198
-
199
-
200
-
201
-
202
-
203
-
204
-
205
-
206
-
207
-
208
-
209
-
210
-
211
-
212
-
213
-
214
-
215
-
216
-
217
-
218
-
219
-
220
-
221
-
222
-
223
-
224
-
225
-
 226
226 -
 227
227 -
 228
228 -
 229
229 -
 230
230 -
 231
231 -
 232
232 -
 233
233 -
 234
234 -
 235
235 -
 236
236 -
 237
237 -
 238
238 -
 239
239 -
 240
240 -
 241
241 -
 242
242 -
 243
243 -
 244
244 -
 245
245 -
 246
246 -
247
-
248
-
249
-
250
-
251
-
252
-
253
-
254
-
255
-
256
-
257
-
258
-
259
-
260
-
261
-
262
-
263
-
264
-
265
-
266
-
267
-
268
-
269
-
270
-
271
-
272
-
273
-
274
-
275
-
276
-
277
-
278
-
279
-
280
 |
 |

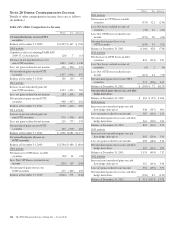
Pretax Tax After-tax
Pension and other postretirement benefit
plan adjustments
Balance at December 31, 2009 $ (858) $316 $(542)
2010 Activity 260 (98) 162
Balance at December 31, 2010 (598) 218 (380)
2011 Activity (593) 218 (375)
Balance at December 31, 2011 (1,191) 436 (755)
2012 Activity (35) 13 (22)
Balance at December 31, 2012 $(1,226) $449 $(777)
Other (a)
Balance at December 31, 2009 $ (27) $ 17 $ (10)
2010 Activity
Foreign currency translation adjustments (18) 6 (12)
BlackRock deferred tax adjustments 1 1
SBA I/O strip valuation adjustments (2) 1 (1)
Total 2010 activity (20) 8 (12)
Balance at December 31, 2010 (47) 25 (22)
2011 Activity
Foreign currency translation adjustments (4) 1 (3)
Total 2011 activity (4) 1 (3)
Balance at December 31, 2011 (51) 26 (25)
2012 Activity
Foreign currency translation adjustments 10 (3) 7
BlackRock deferred tax adjustments (3) (3)
Total 2012 activity 10 (6) 4
Balance at December 31, 2012 $ (41) $ 20 $ (21)
(a) Consists of foreign currency translation adjustments, deferred tax adjustments on
BlackRock’s other comprehensive income, and for 2010 interest-only strip valuation
adjustments.
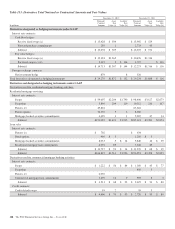
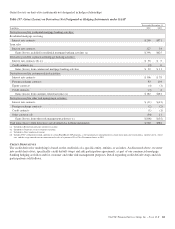
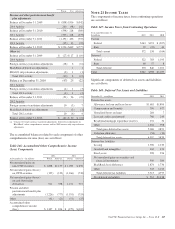
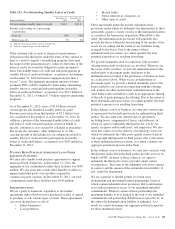
The accumulated balances related to each component of other
comprehensive income (loss) are as follows:
Table 146: Accumulated Other Comprehensive Income
(Loss) Components
2012 2011
At December 31 – In millions Pretax After-tax Pretax After-tax
Net unrealized gains on
non-OTTI securities $ 1,858 $1,177 $ 1,098 $ 696
Net unrealized gains (losses)
on OTTI securities (195) (123) (1,166) (738)
Net unrealized gains (losses)
on cash flow hedge
derivatives 911 578 1,131 717
Pension and other
postretirement benefit plan
adjustments (1,226) (777) (1,191) (755)
Other (41) (21) (51) (25)
Accumulated other
comprehensive income
(loss) $ 1,307 $ 834 $ (179) $(105)
N
OTE
21 I
NCOME
T
AXES
The components of income taxes from continuing operations
are as follows:
Table 147: Income Taxes from Continuing Operations
Year ended December 31
In millions 2012 2011 2010
Current
Federal $343 $191 $ (207)
State 29 (33) 43
Total current 372 158 (164)
Deferred
Federal 522 783 1,193
State 48 57 8
Total deferred 570 840 1,201
Total $942 $998 $1,037
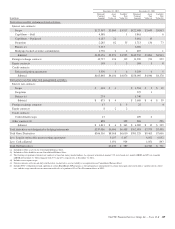
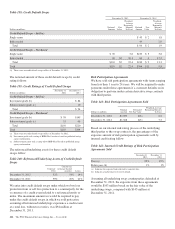
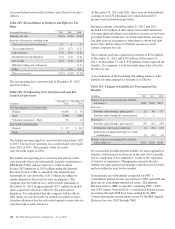
Significant components of deferred tax assets and liabilities
are as follows:
Table 148: Deferred Tax Assets and Liabilities
December 31 – in millions 2012 2011
Deferred tax assets
Allowance for loan and lease losses $1,681 $1,896
Compensation and benefits 790 677
Unrealized losses on loans 284 7
Loss and credit carryforward 766 243
Residential mortgage repurchase reserves 231 32
Other 1,254 998
Total gross deferred tax assets 5,006 3,853
Valuation allowance (54) (14)
Total deferred tax assets 4,952 3,839
Deferred tax liabilities
Leasing 1,396 1,150
Goodwill and intangibles 363 431
Fixed assets 398 256
Net unrealized gains on securities and
financial instruments 939 389
BlackRock basis difference 1,874 1,736
Other 543 1,015
Total deferred tax liabilities 5,513 4,977
Net deferred tax liability $ 561 $1,138
The PNC Financial Services Group, Inc. – Form 10-K 217