Citibank 2014 Annual Report Download - page 99
Download and view the complete annual report
Please find page 99 of the 2014 Citibank annual report below. You can navigate through the pages in the report by either clicking on the pages listed below, or by using the keyword search tool below to find specific information within the annual report.-
 1
1 -
2
-
3
-
4
-
5
-
6
-
7
-
8
-
9
-
10
-
11
-
12
-
13
-
14
-
15
-
16
-
17
-
18
-
19
-
20
-
21
-
22
-
23
-
24
-
25
-
26
-
27
-
28
-
29
-
30
-
31
-
32
-
33
-
34
-
35
-
36
-
37
-
38
-
39
-
40
-
41
-
42
-
43
-
44
-
45
-
46
-
47
-
48
-
49
-
50
-
51
-
52
-
53
-
54
-
55
-
56
-
57
-
58
-
59
-
60
-
61
-
62
-
63
-
64
-
65
-
66
-
67
-
68
-
69
-
70
-
71
-
72
-
73
-
74
-
75
-
76
-
77
-
78
-
79
-
80
-
81
-
82
-
83
-
84
-
85
-
86
-
87
-
88
-
 89
89 -
 90
90 -
 91
91 -
 92
92 -
 93
93 -
 94
94 -
 95
95 -
 96
96 -
 97
97 -
 98
98 -
 99
99 -
 100
100 -
 101
101 -
 102
102 -
 103
103 -
 104
104 -
 105
105 -
 106
106 -
 107
107 -
 108
108 -
 109
109 -
110
-
111
-
112
-
113
-
114
-
115
-
116
-
117
-
118
-
119
-
120
-
121
-
122
-
123
-
124
-
125
-
126
-
127
-
128
-
129
-
130
-
131
-
132
-
133
-
134
-
135
-
136
-
137
-
138
-
139
-
140
-
141
-
142
-
143
-
144
-
145
-
146
-
147
-
148
-
149
-
150
-
151
-
152
-
153
-
154
-
155
-
156
-
157
-
158
-
159
-
160
-
161
-
162
-
163
-
164
-
165
-
166
-
167
-
168
-
169
-
170
-
171
-
172
-
173
-
174
-
175
-
176
-
177
-
178
-
179
-
180
-
181
-
182
-
183
-
184
-
185
-
186
-
187
-
188
-
189
-
190
-
191
-
192
-
193
-
194
-
195
-
196
-
197
-
198
-
199
-
200
-
201
-
202
-
203
-
204
-
205
-
206
-
207
-
208
-
209
-
210
-
211
-
212
-
213
-
214
-
215
-
216
-
217
-
218
-
219
-
220
-
221
-
222
-
223
-
224
-
225
-
226
-
227
-
228
-
229
-
230
-
231
-
232
-
233
-
234
-
235
-
236
-
237
-
238
-
239
-
240
-
241
-
242
-
243
-
244
-
245
-
246
-
247
-
248
-
249
-
250
-
251
-
252
-
253
-
254
-
255
-
256
-
257
-
258
-
259
-
260
-
261
-
262
-
263
-
264
-
265
-
266
-
267
-
268
-
269
-
270
-
271
-
272
-
273
-
274
-
275
-
276
-
277
-
278
-
279
-
280
-
281
-
282
-
283
-
284
-
285
-
286
-
287
-
288
-
289
-
290
-
291
-
292
-
293
-
294
-
295
-
296
-
297
-
298
-
299
-
300
-
301
-
302
-
303
-
304
-
305
-
306
-
307
-
308
-
309
-
310
-
311
-
312
-
313
-
314
-
315
-
316
-
317
-
318
-
319
-
320
-
321
-
322
-
323
-
324
-
325
-
326
-
327
 |
 |
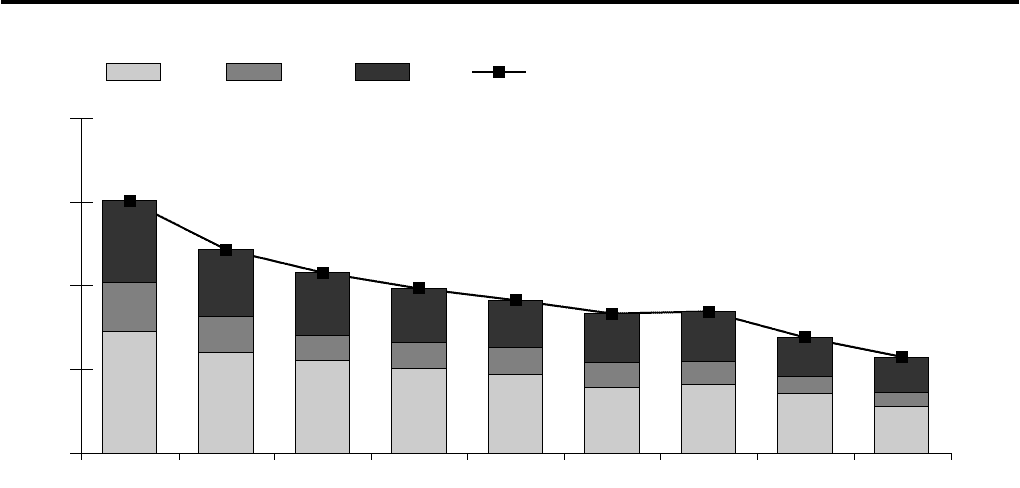
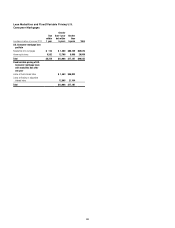
82
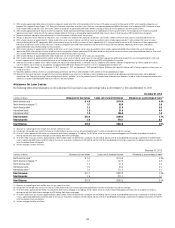
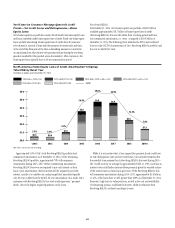
North America Residential First Mortgage Delinquencies—Citi Holdings
In billions of dollars
Days Past Due:
0
2
4
8
6
30+ DPD
180+
90-179
30-89
4Q’143Q’142Q’141Q’144Q’133Q’132Q’131Q’134Q’12
2.91 2.41 2.21 2.02 1.88 1.58 1.64 1.43 1.12
1.17
0.85 0.61 0.63 0.64 0.59 0.55 0.41 0.34
1.95
1.61 1.50 1.30 1.13 1.18 1.20
0.84
0.94
6.03
4.87
4.32 3.94 3.66 3.34 3.39
2.77 2.31
Note: Days past due excludes (i) U.S. mortgage loans that are guaranteed by U.S. government-sponsored agencies because the potential loss predominantly resides with the U.S. agencies, and (ii) loans recorded at fair value.
Totals may not sum due to rounding.
Credit performance (net credit losses and delinquencies) of the residential
first mortgage portfolio continued to improve during 2014, although the
home price index (HPI), which varies from market to market (as indicated
in the table below), moderated throughout 2014 compared to the prior
year. The decline in net credit losses during 2014 was driven by continued
improvement in credit, HPI, the economic environment and continued
management actions, primarily asset sales and loans transferred to held-
for-sale and, to a lesser extent, loan modifications. CitiFinancial’s net credit
losses improved more modestly in 2014 compared to CitiMortgage, including
an increase in net credit losses in the fourth quarter of 2014 due to portfolio
seasoning and loss mitigation activities.
Residential first mortgages originated by CitiFinancial have a higher
net credit loss rate (4.6%, compared to 0.4% for CitiMortgage as of the
fourth quarter of 2014), as CitiFinancial borrowers tend to have higher LTVs
and lower FICOs than CitiMortgage borrowers. CitiFinancial’s residential
first mortgages also have a significantly different geographic distribution,
with different mortgage market conditions that tend to lag the overall
improvements in HPI.
During 2014, continued management actions, primarily assets sales and
loans transferred to held-for-sale and, to a lesser extent, loan modifications,
were the primary drivers of the overall improvement in delinquencies in Citi
Holdings’ residential first mortgage portfolio. Citi sold or transferred to held-
for-sale approximately $1.2 billion of delinquent residential first mortgages
in 2014 (compared to $2.1 billion in 2013), including $0.6 billion during
the fourth quarter of 2014. Credit performance from quarter to quarter could
continue to be impacted by the volume of delinquent loan sales (or lack of
significant sales) and HPI, as well as increases in interest rates.