Citibank 2014 Annual Report Download - page 67
Download and view the complete annual report
Please find page 67 of the 2014 Citibank annual report below. You can navigate through the pages in the report by either clicking on the pages listed below, or by using the keyword search tool below to find specific information within the annual report.-
 1
1 -
2
-
3
-
4
-
5
-
6
-
7
-
8
-
9
-
10
-
11
-
12
-
13
-
14
-
15
-
16
-
17
-
18
-
19
-
20
-
21
-
22
-
23
-
24
-
25
-
26
-
27
-
28
-
29
-
30
-
31
-
32
-
33
-
34
-
35
-
36
-
37
-
38
-
39
-
40
-
41
-
42
-
43
-
44
-
45
-
46
-
47
-
48
-
49
-
50
-
51
-
52
-
53
-
54
-
55
-
56
-
 57
57 -
 58
58 -
 59
59 -
 60
60 -
 61
61 -
 62
62 -
 63
63 -
 64
64 -
 65
65 -
 66
66 -
 67
67 -
 68
68 -
 69
69 -
 70
70 -
 71
71 -
 72
72 -
 73
73 -
 74
74 -
 75
75 -
 76
76 -
 77
77 -
78
-
79
-
80
-
81
-
82
-
83
-
84
-
85
-
86
-
87
-
88
-
89
-
90
-
91
-
92
-
93
-
94
-
95
-
96
-
97
-
98
-
99
-
100
-
101
-
102
-
103
-
104
-
105
-
106
-
107
-
108
-
109
-
110
-
111
-
112
-
113
-
114
-
115
-
116
-
117
-
118
-
119
-
120
-
121
-
122
-
123
-
124
-
125
-
126
-
127
-
128
-
129
-
130
-
131
-
132
-
133
-
134
-
135
-
136
-
137
-
138
-
139
-
140
-
141
-
142
-
143
-
144
-
145
-
146
-
147
-
148
-
149
-
150
-
151
-
152
-
153
-
154
-
155
-
156
-
157
-
158
-
159
-
160
-
161
-
162
-
163
-
164
-
165
-
166
-
167
-
168
-
169
-
170
-
171
-
172
-
173
-
174
-
175
-
176
-
177
-
178
-
179
-
180
-
181
-
182
-
183
-
184
-
185
-
186
-
187
-
188
-
189
-
190
-
191
-
192
-
193
-
194
-
195
-
196
-
197
-
198
-
199
-
200
-
201
-
202
-
203
-
204
-
205
-
206
-
207
-
208
-
209
-
210
-
211
-
212
-
213
-
214
-
215
-
216
-
217
-
218
-
219
-
220
-
221
-
222
-
223
-
224
-
225
-
226
-
227
-
228
-
229
-
230
-
231
-
232
-
233
-
234
-
235
-
236
-
237
-
238
-
239
-
240
-
241
-
242
-
243
-
244
-
245
-
246
-
247
-
248
-
249
-
250
-
251
-
252
-
253
-
254
-
255
-
256
-
257
-
258
-
259
-
260
-
261
-
262
-
263
-
264
-
265
-
266
-
267
-
268
-
269
-
270
-
271
-
272
-
273
-
274
-
275
-
276
-
277
-
278
-
279
-
280
-
281
-
282
-
283
-
284
-
285
-
286
-
287
-
288
-
289
-
290
-
291
-
292
-
293
-
294
-
295
-
296
-
297
-
298
-
299
-
300
-
301
-
302
-
303
-
304
-
305
-
306
-
307
-
308
-
309
-
310
-
311
-
312
-
313
-
314
-
315
-
316
-
317
-
318
-
319
-
320
-
321
-
322
-
323
-
324
-
325
-
326
-
327
 |
 |

50
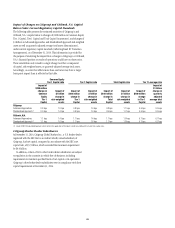
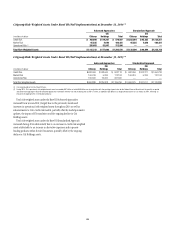
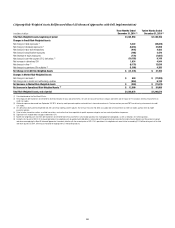
Citigroup Risk-Weighted Assets Rollforward (Basel III Advanced Approaches with Full Implementation)
In millions of dollars
Three Months Ended
December 31, 2014 (1)
Twelve Months Ended
December 31, 2014 (1)
Total Risk-Weighted Assets, beginning of period $1,301,958 $1,185,766
Changes in Credit Risk-Weighted Assets
Net change in retail exposures (2) 5,222 (29,820)
Net change in wholesale exposures (3) (9,316) 31,698
Net change in repo-style transactions (444) 4,483
Net change in securitization exposures (166) 2,470
Net decrease in equity exposures (770) (1,681)
Net change in over-the-counter (OTC) derivatives (4) (10,158) 9,148
Net increase in derivatives CVA 1,834 4,544
Net change in other (5) (6,170) 12,638
Net change in supervisory 6% multiplier (6) (1,308) 4,305
Net change in Credit Risk-Weighted Assets $ (21,276) $ 37,785
Changes in Market Risk-Weighted Assets
Net change in risk levels (7) $ 650 $ (17,803)
Net change due to model and methodology updates (954) 6,130
Net decrease in Market Risk-Weighted Assets $ (304) $ (11,673)
Net increase in Operational Risk-Weighted Assets (8) $ 12,500 $ 81,000
Total Risk-Weighted Assets, end of period $1,292,878 $1,292,878
(1) Calculated based on the Final Basel III Rules.
(2) Retail exposures decreased from year-end 2013, driven by reduction in loans and commitments, the sales of consumer businesses in Spain and Greece and the impact of FX translation, offset by enhancements to
credit risk models.
(3) Wholesale exposures decreased from September 30, 2014, driven by model parameter updates and reductions in loan and commitments. The increase from year-end 2013 was driven by enhancements to credit
risk models.
(4) OTC derivatives decreased from September 30, 2014, driven by model parameter updates. The increase from year-end 2013 was largely due to enhancements to credit risk models, partially offset by model
parameter updates.
(5) Other includes cleared transactions, unsettled transactions, assets other than those reportable in specific exposure categories and non-material portfolios of exposures.
(6) Supervisory 6% multiplier does not apply to derivatives CVA.
(7) Market risk-weighted assets risk levels decreased from year-end 2013 driven by movement in securitization positions from trading book to banking book, as well as reductions in inventory positions.
(8) During the first quarter of 2014, Citi increased operational risk-weighted assets by approximately $56 billion in conjunction with the granting of permission by the Federal Reserve Board to exit the parallel run period
and commence applying the Basel III Advanced Approaches framework, effective with the second quarter of 2014. Citi’s operational risk-weighted assets were further increased by $12.5 billion during each of the third
and fourth quarters of 2014, reflecting an evaluation of ongoing events in the banking industry.