Citibank 2014 Annual Report Download - page 40
Download and view the complete annual report
Please find page 40 of the 2014 Citibank annual report below. You can navigate through the pages in the report by either clicking on the pages listed below, or by using the keyword search tool below to find specific information within the annual report.-
 1
1 -
2
-
3
-
4
-
5
-
6
-
7
-
8
-
9
-
10
-
11
-
12
-
13
-
14
-
15
-
16
-
17
-
18
-
19
-
20
-
21
-
22
-
23
-
24
-
25
-
26
-
27
-
28
-
29
-
 30
30 -
 31
31 -
 32
32 -
 33
33 -
 34
34 -
 35
35 -
 36
36 -
 37
37 -
 38
38 -
 39
39 -
 40
40 -
 41
41 -
 42
42 -
 43
43 -
 44
44 -
 45
45 -
 46
46 -
 47
47 -
 48
48 -
 49
49 -
 50
50 -
51
-
52
-
53
-
54
-
55
-
56
-
57
-
58
-
59
-
60
-
61
-
62
-
63
-
64
-
65
-
66
-
67
-
68
-
69
-
70
-
71
-
72
-
73
-
74
-
75
-
76
-
77
-
78
-
79
-
80
-
81
-
82
-
83
-
84
-
85
-
86
-
87
-
88
-
89
-
90
-
91
-
92
-
93
-
94
-
95
-
96
-
97
-
98
-
99
-
100
-
101
-
102
-
103
-
104
-
105
-
106
-
107
-
108
-
109
-
110
-
111
-
112
-
113
-
114
-
115
-
116
-
117
-
118
-
119
-
120
-
121
-
122
-
123
-
124
-
125
-
126
-
127
-
128
-
129
-
130
-
131
-
132
-
133
-
134
-
135
-
136
-
137
-
138
-
139
-
140
-
141
-
142
-
143
-
144
-
145
-
146
-
147
-
148
-
149
-
150
-
151
-
152
-
153
-
154
-
155
-
156
-
157
-
158
-
159
-
160
-
161
-
162
-
163
-
164
-
165
-
166
-
167
-
168
-
169
-
170
-
171
-
172
-
173
-
174
-
175
-
176
-
177
-
178
-
179
-
180
-
181
-
182
-
183
-
184
-
185
-
186
-
187
-
188
-
189
-
190
-
191
-
192
-
193
-
194
-
195
-
196
-
197
-
198
-
199
-
200
-
201
-
202
-
203
-
204
-
205
-
206
-
207
-
208
-
209
-
210
-
211
-
212
-
213
-
214
-
215
-
216
-
217
-
218
-
219
-
220
-
221
-
222
-
223
-
224
-
225
-
226
-
227
-
228
-
229
-
230
-
231
-
232
-
233
-
234
-
235
-
236
-
237
-
238
-
239
-
240
-
241
-
242
-
243
-
244
-
245
-
246
-
247
-
248
-
249
-
250
-
251
-
252
-
253
-
254
-
255
-
256
-
257
-
258
-
259
-
260
-
261
-
262
-
263
-
264
-
265
-
266
-
267
-
268
-
269
-
270
-
271
-
272
-
273
-
274
-
275
-
276
-
277
-
278
-
279
-
280
-
281
-
282
-
283
-
284
-
285
-
286
-
287
-
288
-
289
-
290
-
291
-
292
-
293
-
294
-
295
-
296
-
297
-
298
-
299
-
300
-
301
-
302
-
303
-
304
-
305
-
306
-
307
-
308
-
309
-
310
-
311
-
312
-
313
-
314
-
315
-
316
-
317
-
318
-
319
-
320
-
321
-
322
-
323
-
324
-
325
-
326
-
327
 |
 |
23
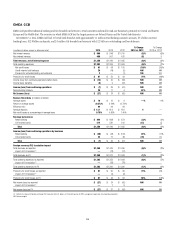
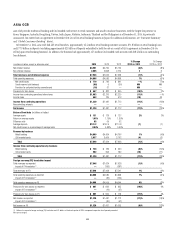
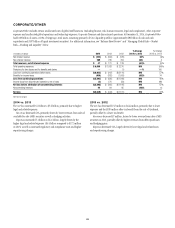
The discussion of the results of operations for Asia GCB below excludes the impact of FX translation for all periods presented. Presentations of the results
of operations, excluding the impact of FX translation, are non-GAAP financial measures. Citi believes the presentation of Asia GCB’s results excluding
the impact of FX translation is a more meaningful depiction of the underlying fundamentals of the business. For a reconciliation of certain of these
metrics to the reported results, see the table above.
2014 vs. 2013
Net income decreased 9%, primarily due to higher expenses, partially offset
by lower credit costs and higher revenues.
Revenues increased 1%, as higher non-interest revenue was partially
offset by a decline in net interest revenue. Non-interest revenue increased
5%, primarily driven by higher fee revenues (largely due to the previously
disclosed distribution agreement that commenced during the first quarter of
2014), partially offset by a decline in investment sales revenues. Net interest
revenue declined 2%, driven by the ongoing impact of regulatory changes,
continued spread compression and the repositioning of the franchise
in Korea.
Retail banking revenues increased 2%, due to the higher insurance
fee revenues, partially offset by lower investment sales revenues and the
repositioning of the franchise in Korea. Investment sales revenues decreased
2%, due to weaker investor sentiment reflecting overall market trends and
strong prior year performance, particularly in the first half of 2013. Citi
expects investment sales revenues will continue to reflect the overall capital
markets environment in the region, including seasonal trends. Average
retail deposits increased 1% (2% excluding Korea) and average retail loans
increased 7% (9% excluding Korea).
Cards revenues decreased 1%, due to the impact of regulatory changes,
particularly in Korea, Indonesia and Singapore, spread compression and
customer deleveraging, largely offset by a 2% increase in average loans and
a 5% increase (8% excluding Korea) in purchase sales driven by growth in
China, India, Singapore and Hong Kong.
While repositioning in Korea continued to have a negative impact on
year-over-year revenue comparisons in Asia GCB, revenues in Korea largely
stabilized in the second half of 2014. Citi expects spread compression and
regulatory changes in several markets across the region will continue to have
a negative impact on Asia GCB revenues in 2015.
Expenses increased 9%, primarily due to higher repositioning charges in
Korea, investment spending and volume-related growth, partially offset by
higher efficiency savings.
Provisions decreased 17%, primarily due to higher loan loss reserve
releases. Overall credit quality remained stable across the region during 2014.
2013 vs. 2012
Net income decreased 12%, primarily due to a higher effective tax rate and
lower revenues, partially offset by lower expenses.
Revenues decreased 1%, as lower net interest revenue was partially offset
by higher non-interest revenue. Net interest revenue declined 5%, primarily
driven by spread compression and the repositioning of the franchise in Korea.
Non-interest revenue increased 7%, mainly driven by growth in investment
sales volume, despite a decrease in volumes in the second half of the year due
to investor sentiment, reflecting overall market uncertainty. Retail banking
revenues decreased 3%, primarily driven by spread compression and the
impact of regulatory changes, partially offset by a 12% increase in investment
sales revenues. Cards revenues increased 2%, as cards purchase sales
increased 7% with growth across the region, partially offset by the continued
impact of regulatory changes and customer deleveraging.
Expenses declined 3%, as lower repositioning charges and efficiency and
repositioning savings were partially offset by increased investment spending,
particularly in China cards.
Provisions increased 4%, reflecting a higher loan loss reserve build due
to volume growth in China, Hong Kong, India and Singapore as well as
regulatory requirements in Korea, partially offset by lower net credit losses.